

Polygon slips below $0.0935 support amid increased volatility near major price levels

Polygon (POL) is trading at $0.1042, marking a daily decline of 7.4%. The token currently sits below its short-term moving averages while remaining supported above its broader medium- and long-term trend indicators.
 0.0831
0.0897
Highlights
- Polygon trading activity has surged as participants focus on key support and resistance levels, increasing order flow near these points.
- Trader attention to technical triggers is increasing market volatility as liquidity builds around major price markers.
- POL/USD trades below short-term moving averages with mixed indicators, expecting consolidation between $0.0935 and $0.1149 over the next 2 to 3 days.
Volatility intensifies as traders cluster around technical pivot points
Trading activity around Polygon has intensified, with market participants closely watching key support and resistance levels, according to Coingabbar. This focus on technical triggers may influence liquidity as traders position around these areas. Awareness of these pivotal points often leads to increased volatility as order flows converge near major markers.
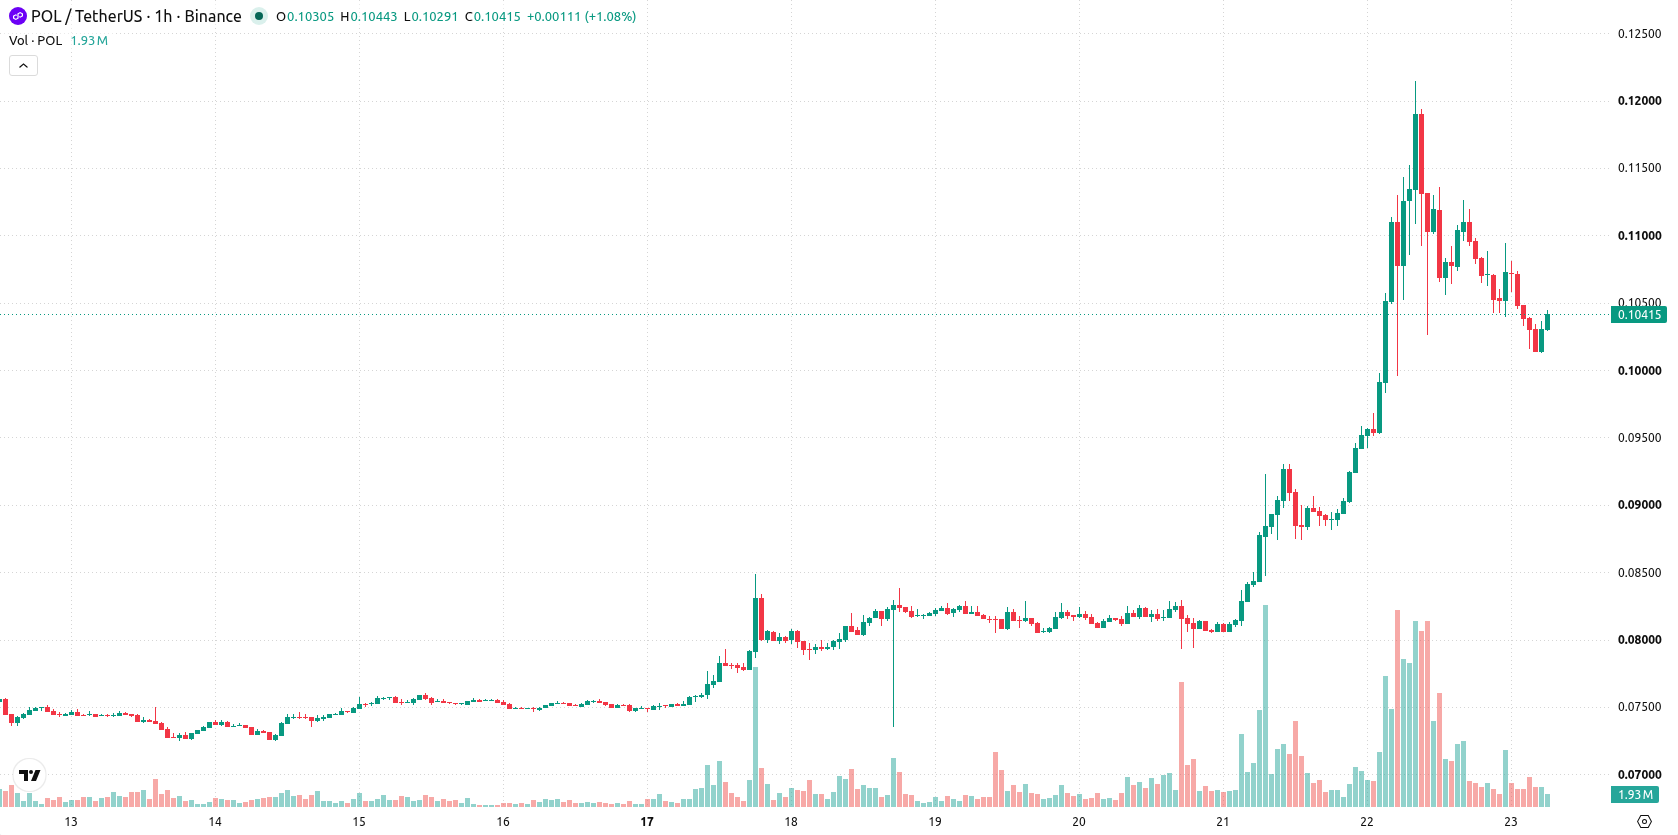
Bearish momentum persists amid mixed signals and key resistance tests
On the technical front, POL/USD traded below the MA-20 but found support above the MA-50, while remaining well above the long-term MA-200. The Ichimoku Kijun at $0.1105 currently serves as an immediate resistance level. Among momentum indicators, RSI signals Sell and the CCI is Oversold, reflecting downward pressure, while MACD presents a Neutral stance and ADX continues to register a Buy, suggesting strong underlying trend persistence. Stoch RSI stands Neutral, Bull/Bear Power favors sellers, and the Awesome Oscillator aligns with recent bearish momentum. Divergence between oscillators and momentum signals points to an uncertain near-term direction.
Range consolidation expected as breakout risk drives directional bias
In the short term, POL/USD is expected to consolidate within a range of $0.0935 to $0.1149 over the next 2–3 trading days, reflecting typical volatility. Baseline expectations call for sideways movement inside this band. Should the price break above $0.1105 resistance, a recovery toward higher levels becomes probable. Conversely, a decline through support at $0.0935 would signal further downside risk and renewed sell interest.
Earlier, analysts noted that Polygon’s price rallies were driven chiefly by broader crypto market movements rather than fundamental changes within the ecosystem, with technical indicators cautioning about potential pullbacks. The latest market action reinforces this cautious stance, highlighting the importance of monitoring the $0.0935 support level, as a sustained breach could indicate a shift toward further downside volatility.











-
 Afghanistan
-
 Albania
-
 Algeria
-
 Angola
-
 Argentina
-
 Armenia
-
 Australia
-
 Austria
-
 Azerbaijan
-
 Bahamas
-
 Bahrain
-
 Bangladesh
-
 Belarus
-
 Belgium
-
 Bolivia
-
 Botswana
-
 Brazil
-
 Brunei
-
 Bulgaria
-
 Cambodia
-
 Cameroon
-
 Canada
-
 Chile
-
 China
-
 Colombia
-
 Congo
-
 Costa Rica
-
 Cote d'Ivoire
-
 Croatia
-
 Cuba
-
 Cyprus
-
 Czechia
-
 DR Congo
-
 Denmark
-
 Dominican Republic
-
 Ecuador
-
 Egypt
-
 El Salvador
-
 Estonia
-
 Eswatini
-
 Ethiopia
-
 Finland
-
 France
-
 Georgia
-
 Germany
-
 Ghana
-
 Greece
-
 Haiti
-
 Hong Kong
-
 Hungary
-
 India
-
 Indonesia
-
 Iran, Islamic republic
-
 Iraq
-
 Ireland
-
 Israel
-
 Italy
-
 Jamaica
-
 Japan
-
 Jordan
-
 Kazakhstan
-
 Kenya
-
 Korea
-
 Kuwait
-
 Kyrgyzstan
-
 Laos
-
 Latvia
-
 Lebanon
-
 Lesotho
-
 Libya
-
 Lithuania
-
 Luxembourg
-
 Madagascar
-
 Malaysia
-
 Malta
-
 Mauritius
-
 Mexico
-
 Moldova
-
 Mongolia
-
 Montenegro
-
 Morocco
-
 Mozambique
-
 Myanmar
-
 Namibia
-
 Nepal
-
 Netherlands
-
 New Zealand
-
 Nigeria
-
 North Macedonia
-
 Norway
-
 Oman
-
 Pakistan
-
 Palestine
-
 Panama
-
 Papua New Guinea
-
 Paraguay
-
 Peru
-
 Philippines
-
 Poland
-
 Portugal
-
 Puerto Rico
-
 Qatar
-
 Reunion
-
 Romania
-
 Rwanda
-
 Saudi Arabia
-
 Serbia
-
 Singapore
-
 Slovakia
-
 Slovenia
-
 Somalia
-
 South Africa
-
 Spain
-
 Sri Lanka
-
 Sweden
-
 Switzerland
-
 Syria
-
 Taiwan
-
 Tajikistan
-
 Tanzania
-
 Thailand
-
 Trinidad and Tobago
-
 Tunisia
-
 Turkey
-
 UAE
-
 Uganda
-
 Ukraine
-
 United Kingdom
-
United States
-
 Uruguay
-
 Uzbekistan
-
 Venezuela
-
 Vietnam
-
 Yemen
-
 Zambia
-
 Zimbabwe
- Forex
- Crypto












