

S slides around 10.5% as price fails to reclaim long-term resistance and heavy volume hits

Sonic (S, formerly Fantom (FTM)) plunged 10.56% as sellers dominated after a downside gap and aggressive intraday selling knocked the price near session lows. The size and pace of the move is supported by heavy volume and the failure to reclaim the 200-day average at $0.0363, which signals continued long-term weakness despite short- and medium-term strength reflected above the 20- and 50-day averages.
 0.061
0.0739
0.061
0.0739
Highlights
- S/USD trades above its short- and medium-term averages but remains in a bearish long-term trend below $0.0363.
- Momentum indicators show buyer dominance and overbought conditions, with mixed signals for trend strength and a potential pause.
- Price fell 10.56% to $0.0265 after a downside gap, with an expected five-day trading range of $0.0213 to $0.033.
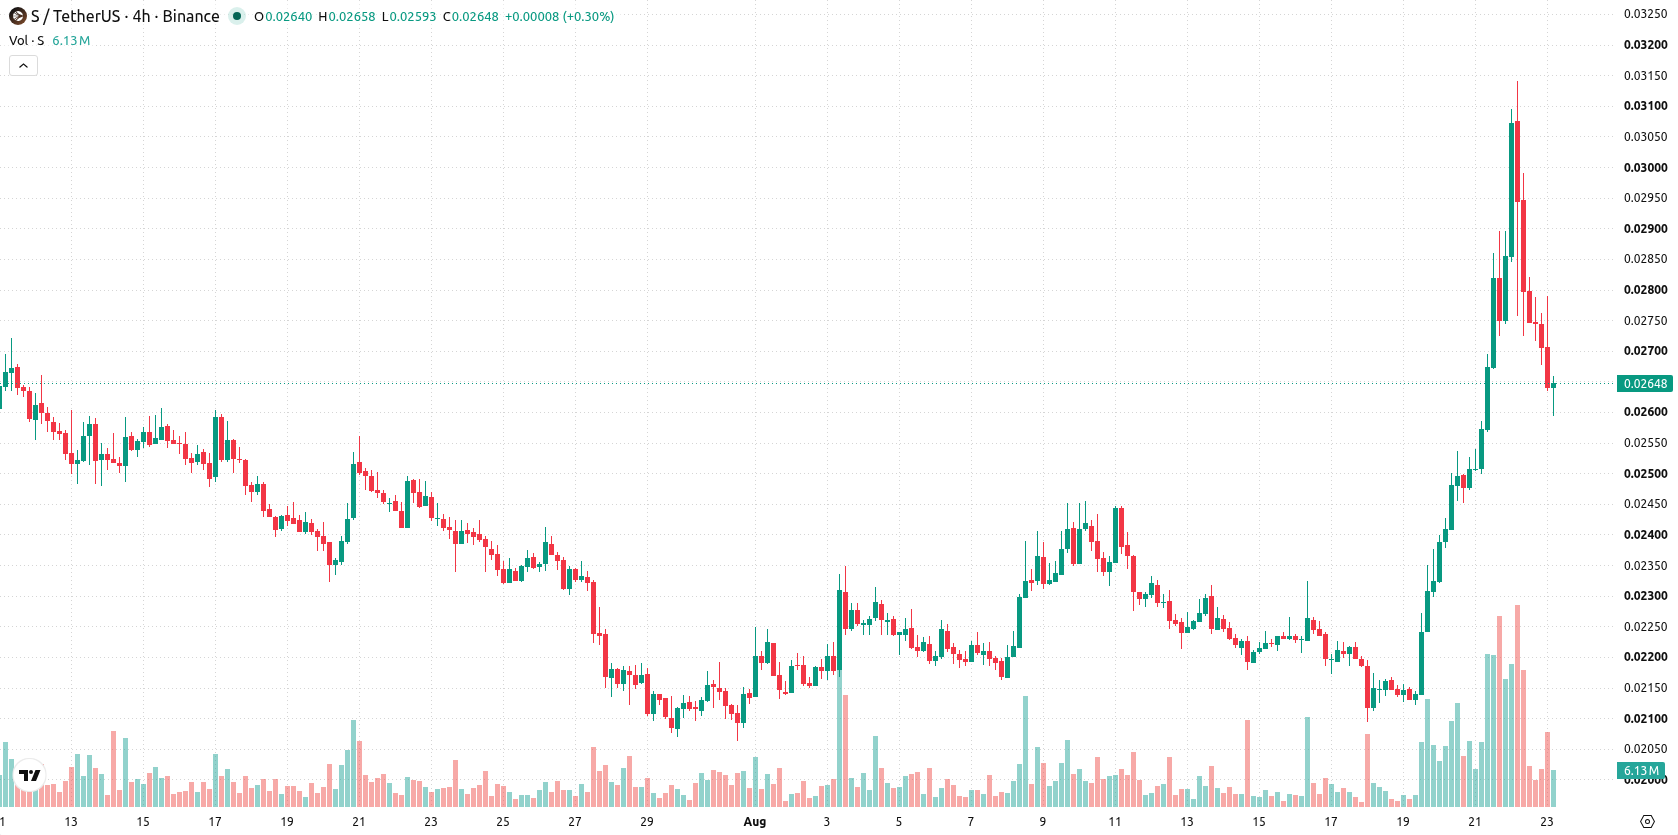
Mixed momentum signals emerge as price nears oversold support
S/USD trades above both its 20-day and 50-day moving averages at $0.0233 and $0.0238, indicating short- and medium-term strength, yet remains below the 200-day average at $0.0363, underlining a prevailing bearish long-term trend. The nearest support is anchored at $0.026 (Ichimoku Kijun), with resistance at $0.0279, today’s high. Momentum readings show the Moving Average Convergence Divergence (MACD) in buy territory, but the Average Directional Index (ADX) signals a neutral trend strength. The Relative Strength Index (RSI) and Bull/Bear Power (BBP) both indicate buyer dominance, with RSI on buy and BBP above zero, while the Commodity Channel Index (CCI) points to overbought conditions. The Stochastic RSI and ADX suggest a pause, with the CCI flagging caution near overextension. Awesome Oscillator (AO) supports recent upward pressure. Price is down at $0.0265, slipping 10.56% today after a downside gap of roughly 8.75%, with volatility at 7.72% and the price trading near session lows. This points to active selling and waning intraday momentum after a weak open.
Earlier, analysts noted that Sonic was experiencing short-term bullish momentum tempered by caution over possible swift reversals amid volatile conditions. The current sharp downside move, combined with persistent long-term weakness, highlights $0.026 as a key support level to monitor for any further downside risk in the coming sessions.










-
 Afghanistan
-
 Albania
-
 Algeria
-
 Angola
-
 Argentina
-
 Armenia
-
 Australia
-
 Austria
-
 Azerbaijan
-
 Bahamas
-
 Bahrain
-
 Bangladesh
-
 Belarus
-
 Belgium
-
 Bolivia
-
 Botswana
-
 Brazil
-
 Brunei
-
 Bulgaria
-
 Cambodia
-
 Cameroon
-
 Canada
-
 Chile
Chile
-
 China
China
-
 Colombia
-
 Congo
Congo
-
 Costa Rica
-
 Cote d'Ivoire
-
 Croatia
-
 Cuba
Cuba
-
 Cyprus
-
 Czechia
-
 DR Congo
-
 Denmark
-
 Dominican Republic
-
 Ecuador
-
 Egypt
Egypt
-
 El Salvador
-
 Estonia
-
 Eswatini
-
 Ethiopia
-
 Finland
-
 France
-
 Georgia
-
 Germany
-
 Ghana
Ghana
-
 Greece
-
 Haiti
Haiti
-
 Hong Kong
-
 Hungary
-
 India
India
-
 Indonesia
-
 Iran, Islamic republic
-
 Iraq
Iraq
-
 Ireland
-
 Israel
-
 Italy
Italy
-
 Jamaica
-
 Japan
Japan
-
 Jordan
-
 Kazakhstan
-
 Kenya
Kenya
-
 Korea
Korea
-
 Kuwait
-
 Kyrgyzstan
-
 Laos
Laos
-
 Latvia
-
 Lebanon
-
 Lesotho
-
 Libya
Libya
-
 Lithuania
-
 Luxembourg
-
 Madagascar
-
 Malaysia
-
 Malta
Malta
-
 Mauritius
-
 Mexico
-
 Moldova
-
 Mongolia
-
 Montenegro
-
 Morocco
-
 Mozambique
-
 Myanmar
-
 Namibia
-
 Nepal
Nepal
-
 Netherlands
-
 New Zealand
-
 Nigeria
-
 North Macedonia
-
 Norway
-
 Oman
Oman
-
 Pakistan
-
 Palestine
-
 Panama
-
 Papua New Guinea
-
 Paraguay
-
 Peru
Peru
-
 Philippines
-
 Poland
-
 Portugal
-
 Puerto Rico
-
 Qatar
Qatar
-
 Reunion
-
 Romania
-
 Rwanda
-
 Saudi Arabia
-
 Serbia
-
 Singapore
-
 Slovakia
-
 Slovenia
-
 Somalia
-
 South Africa
-
 Spain
Spain
-
 Sri Lanka
-
 Sweden
-
 Switzerland
-
 Syria
Syria
-
 Taiwan
-
 Tajikistan
-
 Tanzania
-
 Thailand
-
 Trinidad and Tobago
-
 Tunisia
-
 Turkey
-
 UAE
UAE
-
 Uganda
-
 Ukraine
-
 United Kingdom
-
United States
-
 Uruguay
-
 Uzbekistan
-
 Venezuela
-
 Vietnam
-
 Yemen
Yemen
-
 Zambia
-
 Zimbabwe
- Forex
- Crypto












