

Why is Polygon falling today? Key support levels to watch amid dominant selling

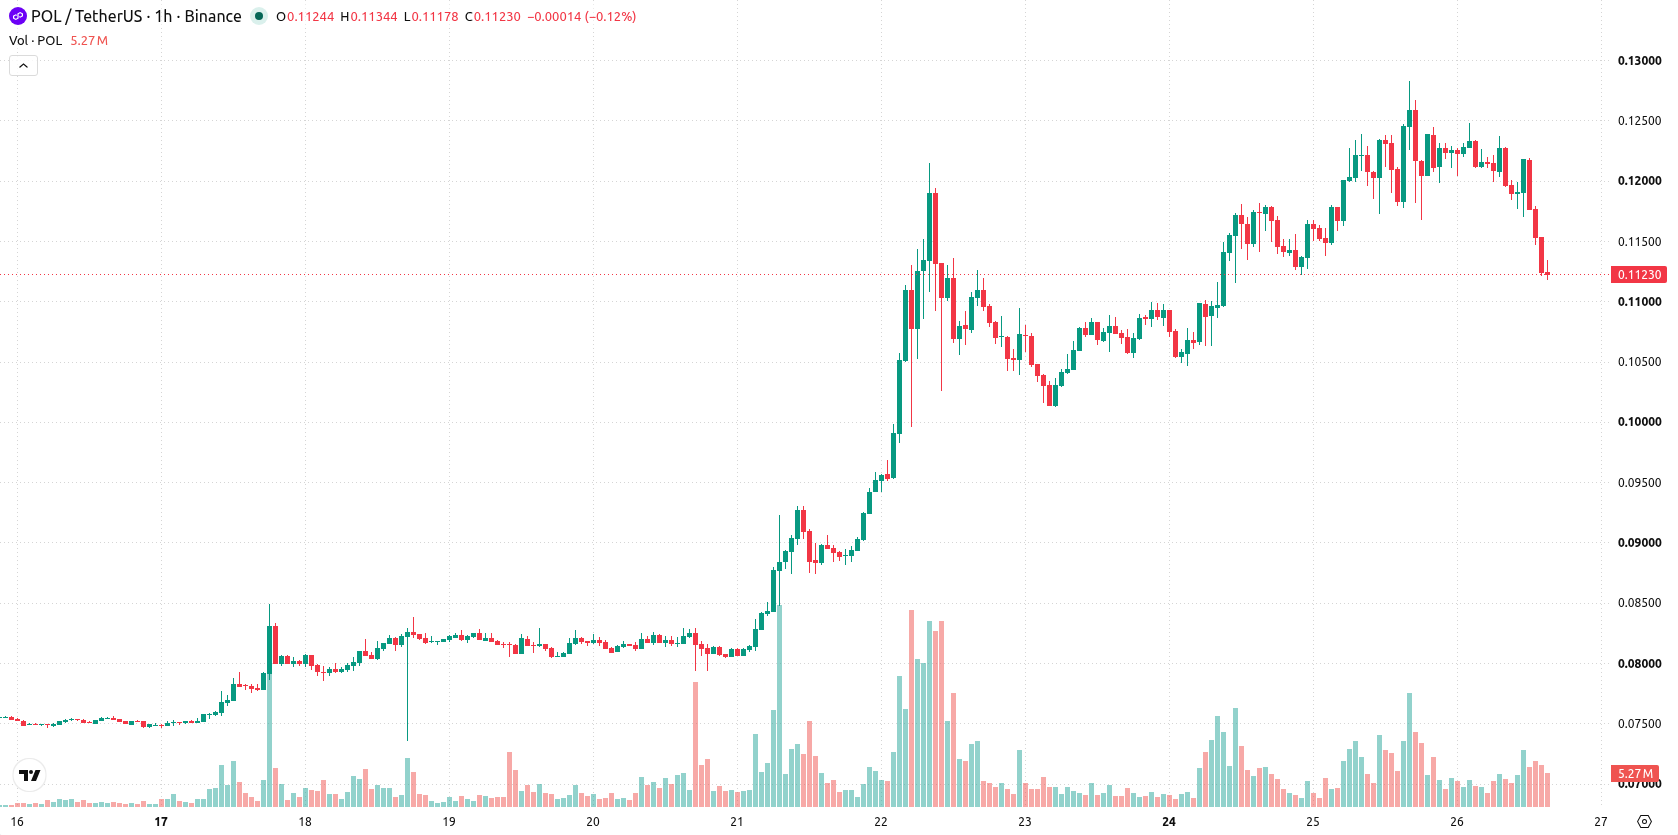
Polygon (POL) is trading at $0.1123, down 7.71% on the day and trading near its daily low. The asset is currently positioned below its short- and medium-term moving averages but remains above the longer-term daily average, reflecting ongoing near-term selling pressure while retaining a degree of broader support.
 0.0813
0.0902
Highlights
- Polygon daily trading volume increased to $216 million, more than tripling its previous 30-day average and increasing ecosystem liquidity.
- On-chain analytics show weekly growth in transactions and protocol revenue, with higher network activity and operational throughput.
- POL trades below short- and medium-term moving averages and remains in a downward trend, with price expected to range from $0.1013 to $0.1233 over the next three days.
User engagement rises as high volume meets persistent selling
Polygon (POL) daily trading volume surged to $216 million, over three times its prior 30-day average, reflecting a marked expansion in trading activity and liquidity across the ecosystem, according to Diariobitcoin. Elevated volume can impact price dynamics by increasing both supply-and-demand responsiveness and the likelihood of outsized moves during periods of volatility. Additional on-chain data from Fxstreet confirmed a week-over-week rise in network transactions and revenue, evidencing elevated protocol activity and higher operational throughput. Together, these developments have enhanced user engagement on the network, though price action has remained under broader selling pressure.
Bearish bias strengthens as support holds amid momentum divergence
On the technical front, POL/USD is trading below the MA-20 at $0.1211 and MA-50 at $0.1195 on the hourly chart, underscoring short- and medium-term pressure, while holding above the daily MA-200 at $0.0886, a level that could provide longer-term support. The Ichimoku Kijun sits at $0.1223, acting as immediate resistance. Among momentum signals, MACD and ADX are neutral, RSI at 40.78 signals a sell bias, and both Stochastic RSI and CCI are oversold, pointing to persistent intraday seller dominance. In addition, Bull/Bear Power confirms selling control, and the Awesome Oscillator trend reinforces this bearish setup, though divergence among oscillators highlights uncertainty and potential volatility.
Downside risk prevails as volatility band constrains direction
In the short term, POL/USD is expected to remain in a volatility band between $0.1013 and $0.1233. There is a higher probability (71%) of a downward move, while the likelihood of an upside reversal is relatively low (29%). The base scenario calls for rangebound trading within the established band. A decisive break above $0.1223 could trigger an intraday recovery, whereas a push below $0.1013 would likely extend the current downtrend and open further downside risk.
Earlier, analysts noted that Polygon’s uptrend was underpinned by robust network activity and infrastructure improvements, with technicals signaling elevated volatility and the potential for a pause. The current article underscores a shift toward bearish near-term pressure despite increased volumes and network engagement, making the $0.1013 to $0.1233 volatility band a critical area for potential breakout or further downside risk.











-
 Afghanistan
-
 Albania
-
 Algeria
-
 Angola
-
 Argentina
-
 Armenia
-
 Australia
-
 Austria
-
 Azerbaijan
-
 Bahamas
-
 Bahrain
-
 Bangladesh
-
 Belarus
-
 Belgium
-
 Bolivia
-
 Botswana
-
 Brazil
-
 Brunei
-
 Bulgaria
-
 Cambodia
-
 Cameroon
-
 Canada
-
 Chile
-
 China
-
 Colombia
-
 Congo
-
 Costa Rica
-
 Cote d'Ivoire
-
 Croatia
-
 Cuba
-
 Cyprus
-
 Czechia
-
 DR Congo
-
 Denmark
-
 Dominican Republic
-
 Ecuador
-
 Egypt
-
 El Salvador
-
 Estonia
-
 Eswatini
-
 Ethiopia
-
 Finland
-
 France
-
 Georgia
-
 Germany
-
 Ghana
-
 Greece
-
 Haiti
-
 Hong Kong
-
 Hungary
-
 India
-
 Indonesia
-
 Iran, Islamic republic
-
 Iraq
-
 Ireland
-
 Israel
-
 Italy
-
 Jamaica
-
 Japan
-
 Jordan
-
 Kazakhstan
-
 Kenya
-
 Korea
-
 Kuwait
-
 Kyrgyzstan
-
 Laos
-
 Latvia
-
 Lebanon
-
 Lesotho
-
 Libya
-
 Lithuania
-
 Luxembourg
-
 Madagascar
-
 Malaysia
-
 Malta
-
 Mauritius
-
 Mexico
-
 Moldova
-
 Mongolia
-
 Montenegro
-
 Morocco
-
 Mozambique
-
 Myanmar
-
 Namibia
-
 Nepal
-
 Netherlands
-
 New Zealand
-
 Nigeria
-
 North Macedonia
-
 Norway
-
 Oman
-
 Pakistan
-
 Palestine
-
 Panama
-
 Papua New Guinea
-
 Paraguay
-
 Peru
-
 Philippines
-
 Poland
-
 Portugal
-
 Puerto Rico
-
 Qatar
-
 Reunion
-
 Romania
-
 Rwanda
-
 Saudi Arabia
-
 Serbia
-
 Singapore
-
 Slovakia
-
 Slovenia
-
 Somalia
-
 South Africa
-
 Spain
-
 Sri Lanka
-
 Sweden
-
 Switzerland
-
 Syria
-
 Taiwan
-
 Tajikistan
-
 Tanzania
-
 Thailand
-
 Trinidad and Tobago
-
 Tunisia
-
 Turkey
-
 UAE
-
 Uganda
-
 Ukraine
-
 United Kingdom
-
United States
-
 Uruguay
-
 Uzbekistan
-
 Venezuela
-
 Vietnam
-
 Yemen
-
 Zambia
-
 Zimbabwe
- Forex
- Crypto












