


Pyth (PYTH) dropped 11.69% after a sharp price decline followed a surge in trading volume linked to broad crypto market corrections and regulatory uncertainty. The scale of the decline contradicts the technical structure, as the asset remains above its key moving averages and bullish indicators persist.
 0.068
0.0769
Highlights
- Pyth Network now supports real-time market data from over 138 institutions and offers 3,501 feeds across 114 blockchains and 710 applications.
- A surge in trading volume reached 229% above the monthly average during a 24-hour cryptocurrency market correction with ongoing regulatory uncertainty.
- Technicals indicate bullish momentum, but price slipped 11.69% to $0.0475 and may trade between $0.0408 and $0.0595 over the next five days.
Institutional data expansion as selling pressure tracks volume surge
Pyth Network expanded its ecosystem, reaching over 138 institutions publishing real-time market data and covering 3,501 market data feeds across more than 114 blockchains and 710 applications. Contributors such as Fenics Market Data, SGX FX, Jane Street, and Coinbase have continued to provide institutional-grade pricing data, including U.S. Treasury yields and global currency pairs. A recent surge in trading volume by 229% above the monthly average was recorded during a 24-hour period of heightened selling, attributed to broader cryptocurrency market corrections and increased regulatory uncertainty affecting sentiment, though price action has remained under broader selling pressure.
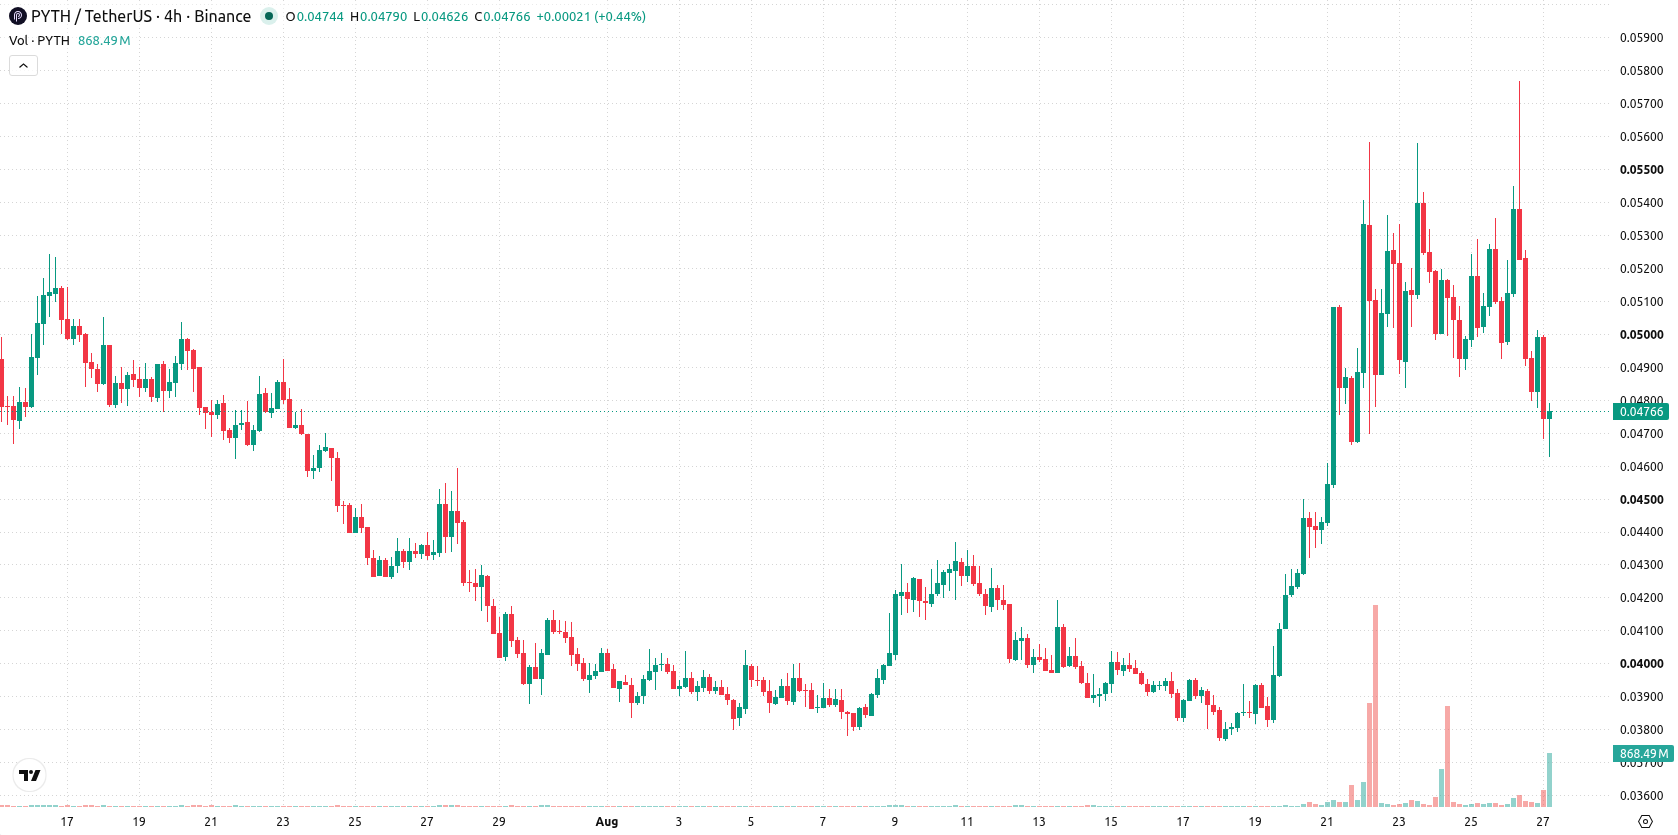
Positive momentum diverges from sustained session lows
PYTH/USD is trading above the 20-, 50-, and 200-day moving averages (MA-20 at $0.0433, MA-50 at $0.0439, MA-200 at $0.0441), signaling bullish momentum in the short, medium, and long term. The nearest resistance is at the Ichimoku Kijun and near-term ceiling of $0.0477, while immediate support is seen at $0.0463. Longer-term structure remains bearish as the MA-50 sits below the MA-200. Despite positive momentum signals from MACD, ADX, and a positive Bull/Bear Power (BBP), the price decline to $0.0475 and a drop near the session’s low with 7.99% intraday volatility highlight a divergence between price action and indicators. The Relative Strength Index (RSI) at 61.58 reinforces a buy outlook, though the Commodity Channel Index (CCI) is overbought at 121.88 and Stochastic RSI is neutral. Awesome Oscillator readings also support positive momentum, even as selling pressure has dominated the session.
Previously it was reported that bearish momentum and market uncertainty had dominated Pyth, with limited prospects for an upside reversal. The current analysis adds a new dimension by highlighting sustained bullish signals in momentum indicators despite recent volatility, suggesting that traders should closely monitor the $0.0477 resistance as a potential trigger for renewed upward movement.











-
 Afghanistan
-
 Albania
-
 Algeria
-
 Angola
-
 Argentina
-
 Armenia
-
 Australia
-
 Austria
-
 Azerbaijan
-
 Bahamas
-
 Bahrain
-
 Bangladesh
-
 Belarus
-
 Belgium
-
 Bolivia
-
 Botswana
-
 Brazil
-
 Brunei
-
 Bulgaria
-
 Cambodia
-
 Cameroon
-
 Canada
-
 Chile
-
 China
-
 Colombia
-
 Congo
-
 Costa Rica
-
 Cote d'Ivoire
-
 Croatia
-
 Cuba
-
 Cyprus
-
 Czechia
-
 DR Congo
-
 Denmark
-
 Dominican Republic
-
 Ecuador
-
 Egypt
-
 El Salvador
-
 Estonia
-
 Eswatini
-
 Ethiopia
-
 Finland
-
 France
-
 Georgia
-
 Germany
-
 Ghana
-
 Greece
-
 Haiti
-
 Hong Kong
-
 Hungary
-
 India
-
 Indonesia
-
 Iran, Islamic republic
-
 Iraq
-
 Ireland
-
 Israel
-
 Italy
-
 Jamaica
-
 Japan
-
 Jordan
-
 Kazakhstan
-
 Kenya
-
 Korea
-
 Kuwait
-
 Kyrgyzstan
-
 Laos
-
 Latvia
-
 Lebanon
-
 Lesotho
-
 Libya
-
 Lithuania
-
 Luxembourg
-
 Madagascar
-
 Malaysia
-
 Malta
-
 Mauritius
-
 Mexico
-
 Moldova
-
 Mongolia
-
 Montenegro
-
 Morocco
-
 Mozambique
-
 Myanmar
-
 Namibia
-
 Nepal
-
 Netherlands
-
 New Zealand
-
 Nigeria
-
 North Macedonia
-
 Norway
-
 Oman
-
 Pakistan
-
 Palestine
-
 Panama
-
 Papua New Guinea
-
 Paraguay
-
 Peru
-
 Philippines
-
 Poland
-
 Portugal
-
 Puerto Rico
-
 Qatar
-
 Reunion
-
 Romania
-
 Rwanda
-
 Saudi Arabia
-
 Serbia
-
 Singapore
-
 Slovakia
-
 Slovenia
-
 Somalia
-
 South Africa
-
 Spain
-
 Sri Lanka
-
 Sweden
-
 Switzerland
-
 Syria
-
 Taiwan
-
 Tajikistan
-
 Tanzania
-
 Thailand
-
 Trinidad and Tobago
-
 Tunisia
-
 Turkey
-
 UAE
-
 Uganda
-
 Ukraine
-
 United Kingdom
-
United States
-
 Uruguay
-
 Uzbekistan
-
 Venezuela
-
 Vietnam
-
 Yemen
-
 Zambia
-
 Zimbabwe
- Forex
- Crypto












