


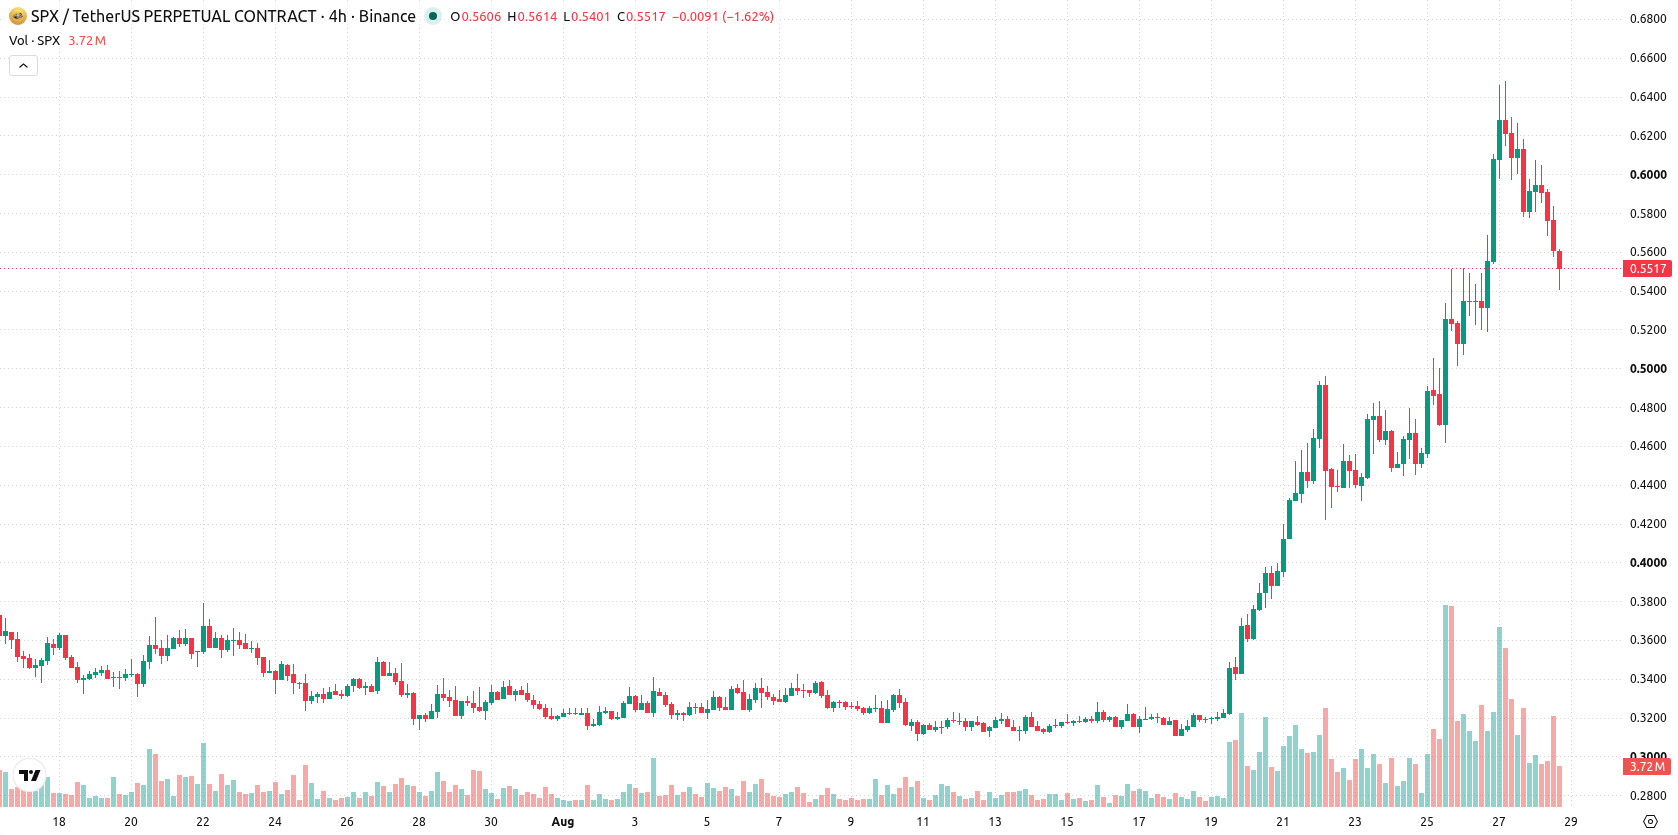
SPX6900 (SPX) dropped 10.46% today as the recent surge in speculative flows gave way to a sharp downside gap and risk-off sentiment. This decline contradicts the prevailing bullish technical structure, with the asset trading above its short-, medium-, and long-term moving averages.
 0.268
0.3304
Highlights
- SPX6900 saw robust spot and derivatives demand, with Open Interest jumping 30% in one day amid heavy trading activity.
- The asset cleared several key technical retracement levels and traded above major exponential moving averages, outperforming other crypto assets even as selling pressure persisted.
- Technical indicators signal strong but overbought conditions, with a near-term range of $0.4396 to $0.7388 and $0.5581 as key resistance.
Sustained demand unwinds amid persistent selling pressure
SPX6900, a memecoin built on the SPX6900 ecosystem, recorded strong market activity in recent sessions, with significant spot and derivatives demand supported by a 30% increase in Open Interest in one day. The asset was reported to be positioned above key exponential moving averages and outperformed other crypto assets. Major technical retracement levels were also cleared, indicating prior bullish momentum, though price action has remained under broader selling pressure.
Overbought signals persist as momentum contrasts with price drop
SPX6900 is trading above its 20-day, 50-day, and 200-day moving averages, with the current price at $0.5495 above $0.3908, $0.3631, and $0.3449, respectively. This signals a bullish structure across short-, medium-, and long-term trends. The Ichimoku Kijun at $0.4777 acts as the nearest support, while $0.5581 marks near-term resistance. Momentum indicators remain strong, with the MACD and ADX showing ongoing buyer strength. However, the RSI at 81.29 and CCI at 184.65 indicate overbought conditions, as does the Stochastic RSI above 90. Bull/Bear Power is positive at 0.187, suggesting buyers are still in control intraday, and the Awesome Oscillator aligns with upward momentum. Despite the bearish price action, these technicals reflect a short-term divergence as the asset has declined $0.0642, or 10.46%, with a downside gap of 3.76% and intraday volatility at 8.55%. Price remains close to the daily low, with session pressure after the open.
Earlier, analysts noted that SPX6900’s strong price advances were driven by bullish technical structure and speculative momentum rather than fundamental catalysts. The recent sharp pullback despite ongoing bullish indicators introduces a key test, with traders advised to watch for a potential breakout above $0.5581 or a downside move below $0.4777 to define near-term direction.









-
 Afghanistan
-
 Albania
-
 Algeria
-
 Angola
-
 Argentina
-
 Armenia
-
 Australia
-
 Austria
-
 Azerbaijan
-
 Bahamas
-
 Bahrain
-
 Bangladesh
-
 Belarus
-
 Belgium
-
 Bolivia
-
 Botswana
-
 Brazil
-
 Brunei
-
 Bulgaria
-
 Cambodia
-
 Cameroon
-
 Canada
-
 Chile
-
 China
-
 Colombia
-
 Congo
-
 Costa Rica
-
 Cote d'Ivoire
-
 Croatia
-
 Cuba
-
 Cyprus
-
 Czechia
-
 DR Congo
-
 Denmark
-
 Dominican Republic
-
 Ecuador
-
 Egypt
-
 El Salvador
-
 Estonia
-
 Eswatini
-
 Ethiopia
-
 Finland
-
 France
-
 Georgia
-
 Germany
-
 Ghana
-
 Greece
-
 Haiti
-
 Hong Kong
-
 Hungary
-
 India
-
 Indonesia
-
 Iran, Islamic republic
-
 Iraq
-
 Ireland
-
 Israel
-
 Italy
-
 Jamaica
-
 Japan
-
 Jordan
-
 Kazakhstan
-
 Kenya
-
 Korea
-
 Kuwait
-
 Kyrgyzstan
-
 Laos
-
 Latvia
-
 Lebanon
-
 Lesotho
-
 Libya
-
 Lithuania
-
 Luxembourg
-
 Madagascar
-
 Malaysia
-
 Malta
-
 Mauritius
-
 Mexico
-
 Moldova
-
 Mongolia
-
 Montenegro
-
 Morocco
-
 Mozambique
-
 Myanmar
-
 Namibia
-
 Nepal
-
 Netherlands
-
 New Zealand
-
 Nigeria
-
 North Macedonia
-
 Norway
-
 Oman
-
 Pakistan
-
 Palestine
-
 Panama
-
 Papua New Guinea
-
 Paraguay
-
 Peru
-
 Philippines
-
 Poland
-
 Portugal
-
 Puerto Rico
-
 Qatar
-
 Reunion
-
 Romania
-
 Rwanda
-
 Saudi Arabia
-
 Serbia
-
 Singapore
-
 Slovakia
-
 Slovenia
-
 Somalia
-
 South Africa
-
 Spain
-
 Sri Lanka
-
 Sweden
-
 Switzerland
-
 Syria
-
 Taiwan
-
 Tajikistan
-
 Tanzania
-
 Thailand
-
 Trinidad and Tobago
-
 Tunisia
-
 Turkey
-
 UAE
-
 Uganda
-
 Ukraine
-
 United Kingdom
-
United States
-
 Uruguay
-
 Uzbekistan
-
 Venezuela
-
 Vietnam
-
 Yemen
-
 Zambia
-
 Zimbabwe
- Forex
- Crypto












