

Dash price outlook: Mixed momentum keeps the outlook uncertain

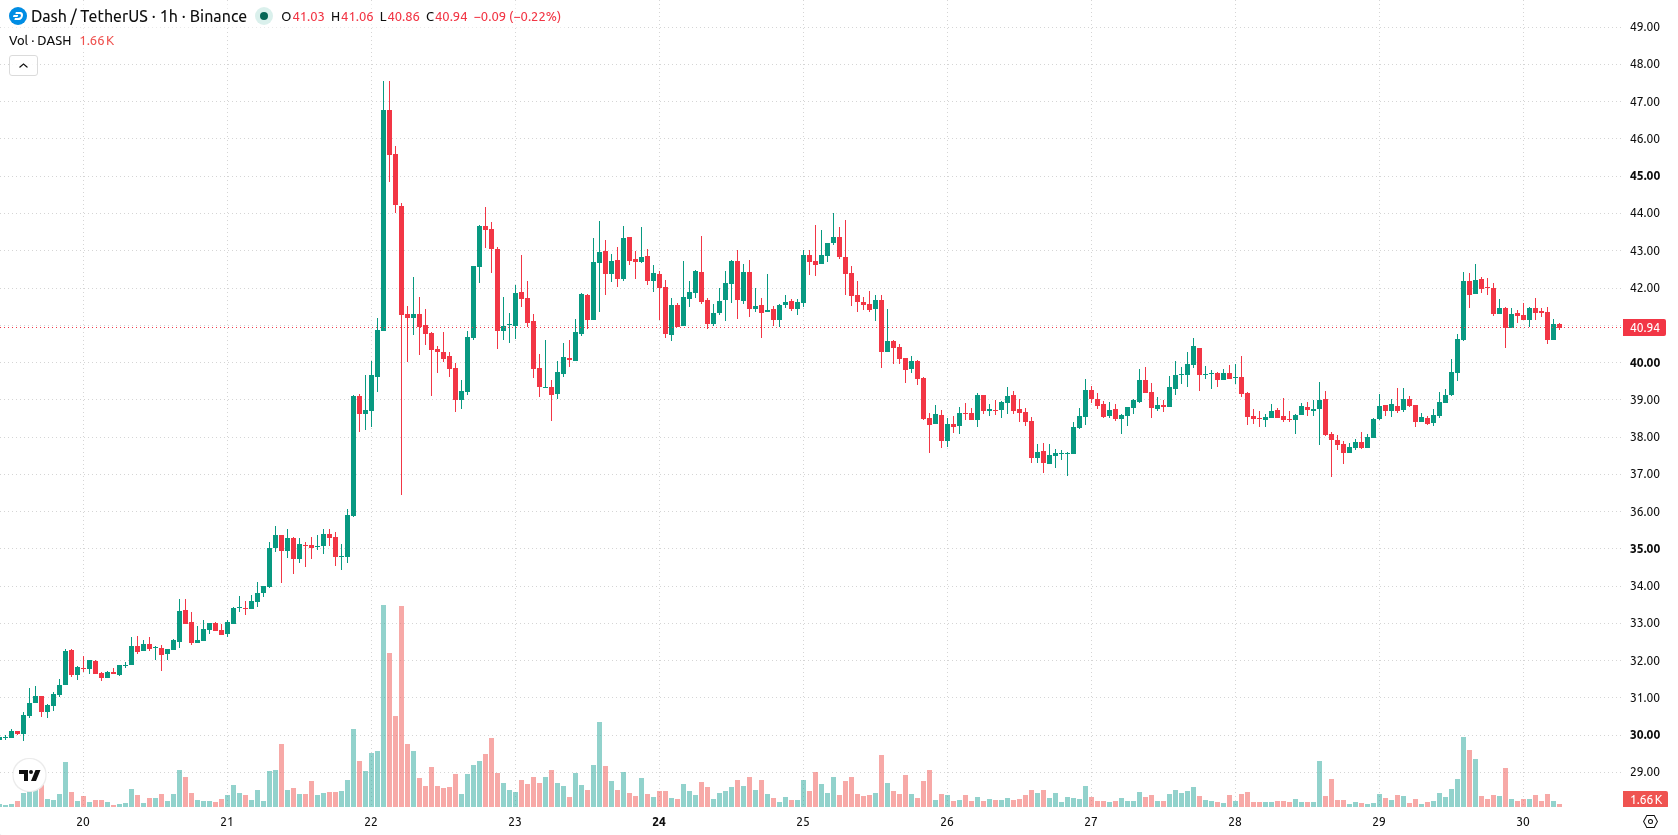
Dash (DASH) is trading at $40.97, up 6.94% on the day. The price sits below its short-term moving average, but holds above key medium- and long-term averages.
 171.13
179.59
Highlights
- DASH/USD is trading below short-term moving averages but holds above long-term support, with mixed momentum indicators.
- Price has gained 6.94% on the day with moderate volatility, ending near the session low and showing no decisive upward momentum.
- Expected two to three day range is $39.38 to $42.95, with a high probability of sideways movement and buyers needing to clear $42.95 for a bullish move.
Divergent oscillator readings as DASH tests volatility lows
On the hourly chart, DASH/USD is trading below the MA-20 but remains above the MA-50, while on the daily timeframe the pair is still holding above the MA-200. The Ichimoku Kijun sits at $40.45 and serves as immediate support. Momentum signals remain mixed: MACD indicates strong buy momentum, Stoch RSI is oversold, and RSI is in buy territory; however, ADX, CCI, and Awesome Oscillator all read neutral, while Bull/Bear Power signals seller dominance intraday. DASH/USD is near its session low as volatility remains moderate, highlighting notable divergence among the oscillators.
Rangebound consolidation expected as volatility tempers breakout risk
Over the next two to three trading days, DASH/USD is likely to remain rangebound between $39.38 and $42.95 given the current volatility band. The baseline scenario anticipates consolidation within these boundaries. Should buyers gain traction, a breakout above $42.95 would open up further upside, whereas a sustained move below $39.38 would indicate a shift toward short-term weakness.
Earlier, analysts noted that Dash had established a period of stabilization backed by continued bullish momentum across multiple timeframes. The current technical setup, with mixed momentum signals and price action clustered below short-term averages, suggests traders should watch for a decisive move outside the $39.38–$42.95 range as a potential indicator of the next directional trend.










-
 Afghanistan
-
 Albania
-
 Algeria
-
 Angola
-
 Argentina
-
 Armenia
-
 Australia
-
 Austria
-
 Azerbaijan
-
 Bahamas
-
 Bahrain
-
 Bangladesh
-
 Belarus
-
 Belgium
-
 Bolivia
-
 Botswana
-
 Brazil
-
 Brunei
-
 Bulgaria
-
 Cambodia
-
 Cameroon
-
 Canada
-
 Chile
-
 China
-
 Colombia
-
 Congo
-
 Costa Rica
-
 Cote d'Ivoire
-
 Croatia
-
 Cuba
-
 Cyprus
-
 Czechia
-
 DR Congo
-
 Denmark
-
 Dominican Republic
-
 Ecuador
-
 Egypt
-
 El Salvador
-
 Estonia
-
 Eswatini
-
 Ethiopia
-
 Finland
-
 France
-
 Georgia
-
 Germany
-
 Ghana
-
 Greece
-
 Haiti
-
 Hong Kong
-
 Hungary
-
 India
-
 Indonesia
-
 Iran, Islamic republic
-
 Iraq
-
 Ireland
-
 Israel
-
 Italy
-
 Jamaica
-
 Japan
-
 Jordan
-
 Kazakhstan
-
 Kenya
-
 Korea
-
 Kuwait
-
 Kyrgyzstan
-
 Laos
-
 Latvia
-
 Lebanon
-
 Lesotho
-
 Libya
-
 Lithuania
-
 Luxembourg
-
 Madagascar
-
 Malaysia
-
 Malta
-
 Mauritius
-
 Mexico
-
 Moldova
-
 Mongolia
-
 Montenegro
-
 Morocco
-
 Mozambique
-
 Myanmar
-
 Namibia
-
 Nepal
-
 Netherlands
-
 New Zealand
-
 Nigeria
-
 North Macedonia
-
 Norway
-
 Oman
-
 Pakistan
-
 Palestine
-
 Panama
-
 Papua New Guinea
-
 Paraguay
-
 Peru
-
 Philippines
-
 Poland
-
 Portugal
-
 Puerto Rico
-
 Qatar
-
 Reunion
-
 Romania
-
 Rwanda
-
 Saudi Arabia
-
 Serbia
-
 Singapore
-
 Slovakia
-
 Slovenia
-
 Somalia
-
 South Africa
-
 Spain
-
 Sri Lanka
-
 Sweden
-
 Switzerland
-
 Syria
-
 Taiwan
-
 Tajikistan
-
 Tanzania
-
 Thailand
-
 Trinidad and Tobago
-
 Tunisia
-
 Turkey
-
 UAE
-
 Uganda
-
 Ukraine
-
 United Kingdom
-
United States
-
 Uruguay
-
 Uzbekistan
-
 Venezuela
-
 Vietnam
-
 Yemen
-
 Zambia
-
 Zimbabwe
- Forex
- Crypto












