

SPX6900 drops over 11% after heightened trading activity and macro-driven swings

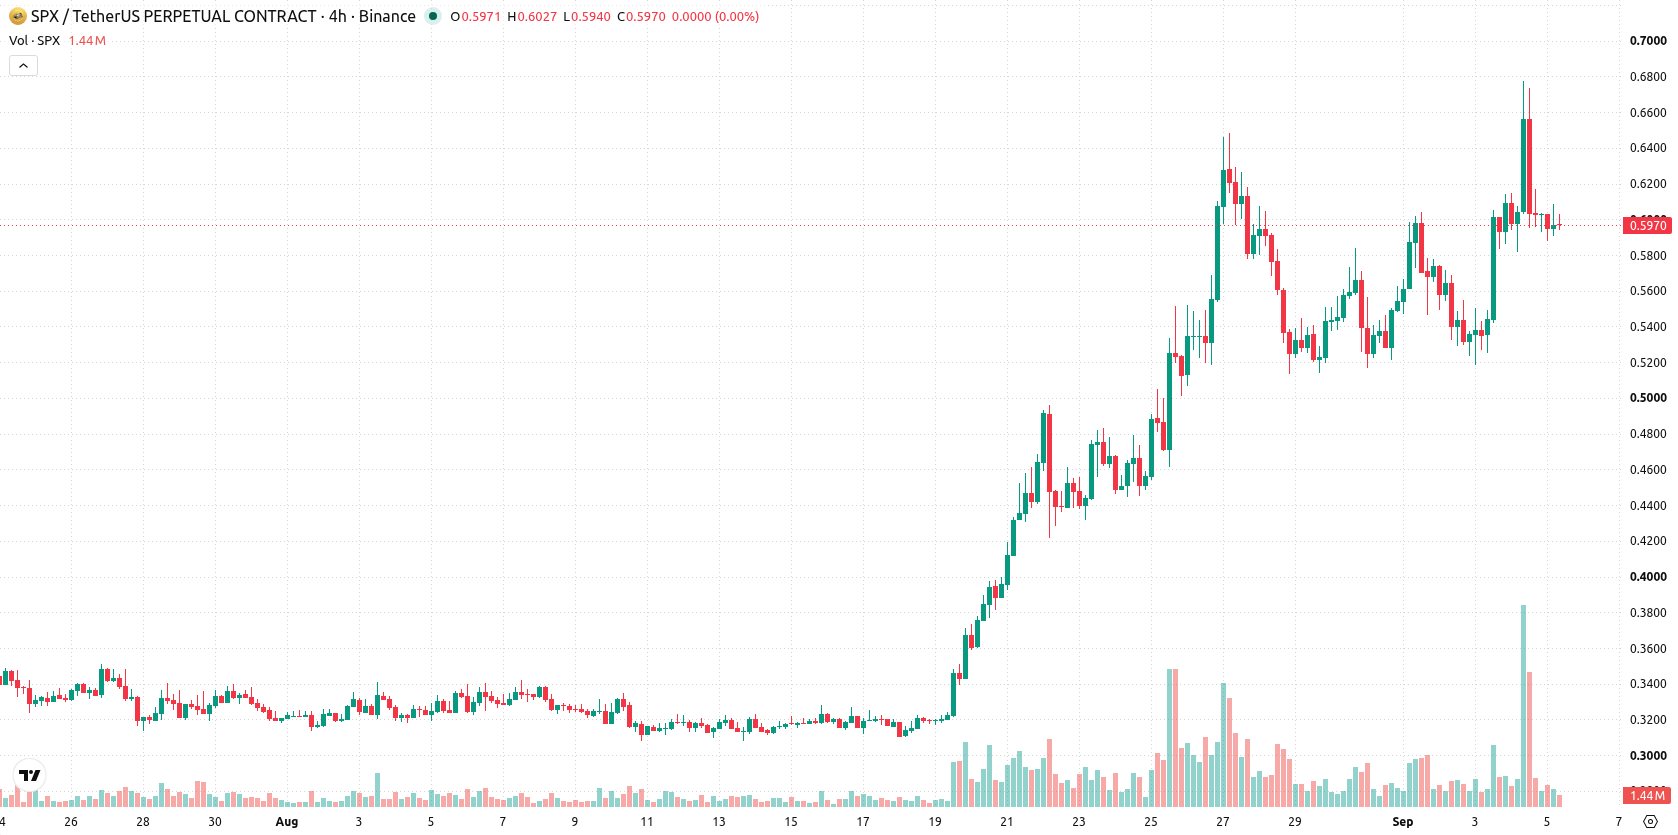
SPX6900 (SPX) dropped 11.05% today after heightened trading activity followed a surge in volume and market volatility linked to macroeconomic drivers. The sharp decline is partially supported by a mixed technical picture, as the price remains above major moving averages but faces caution from overbought oscillators and a near-term ceiling.
 0.3094
0.3844
Highlights
- SPX6900 daily trading volume nearly tripled its 30-day average on September 4, 2026, amid a stronger-than-expected US employment update and large Bitcoin ETF outflows.
- SPX6900 remains a narrative-driven meme coin with no yield, maintaining cultural relevance but trading under market-wide selling pressure.
- SPX6900 trades in a bullish structure above key moving averages, with projected five-session price range at $0.5173 to $0.6753 and overbought signals cautioning against further upside.
Heavy meme coin outflows rise as jobs data and Bitcoin ETF shifts
SPX6900 saw significant trading activity on September 4, 2026, as daily trading volume nearly tripled its 30-day average amid reports of a stronger-than-expected US employment update and large outflows from Bitcoin ETFs, which increased volatility in crypto markets. The token is purely narrative-driven with no productive protocol or yield, and has gained attention for its satirical take on financial indices. SPX6900 remains notable among meme coins and is listed among culturally significant meme assets, though price action has remained under broader selling pressure.
Bullish structure holds as overbought signals and mixed oscillators warn
SPX6900 is trading above its 20-day, 50-day, and 200-day moving averages at $0.4869, $0.3936, and $0.355 respectively, confirming a bullish structure in short-, medium-, and long-term trends. Immediate technical attention is on the resistance at $0.6094 and support at $0.588, with the Ichimoku Kijun at $0.4914 reinforcing the broader uptrend. Momentum indicators remain positive, with the MACD and ADX both indicating "Buy" signals. The RSI stands at 67.73, close to overbought territory, as confirmed by the Commodity Channel Index (CCI), while the Stochastic RSI is weak, suggesting a possible near-term pullback. Bull/Bear Power (BBP) at 0.1385 signals buyers' dominance intraday, but caution is warranted due to the overbought reading from CCI. Intraday volatility is measured at 3.64%, and a downside gap of approximately 10.28% was observed. The session indicates consolidation, with mixed signals from oscillators.
Earlier, analysts noted that SPX6900 was demonstrating robust bullish momentum supported by strong technical indicators and speculative trading activity. The current article introduces a new dynamic, as elevated macro-driven volatility and overbought signals now raise the risk of a near-term pullback, making the $0.6094 resistance a critical level to monitor for trend confirmation.










-
 Afghanistan
-
 Albania
-
 Algeria
-
 Angola
-
 Argentina
-
 Armenia
-
 Australia
-
 Austria
-
 Azerbaijan
-
 Bahamas
-
 Bahrain
-
 Bangladesh
-
 Belarus
-
 Belgium
-
 Bolivia
-
 Botswana
-
 Brazil
-
 Brunei
-
 Bulgaria
-
 Cambodia
-
 Cameroon
-
 Canada
-
 Chile
-
 China
-
 Colombia
-
 Congo
-
 Costa Rica
-
 Cote d'Ivoire
-
 Croatia
-
 Cuba
-
 Cyprus
-
 Czechia
-
 DR Congo
-
 Denmark
-
 Dominican Republic
-
 Ecuador
-
 Egypt
-
 El Salvador
-
 Estonia
-
 Eswatini
-
 Ethiopia
-
 Finland
-
 France
-
 Georgia
-
 Germany
-
 Ghana
-
 Greece
-
 Haiti
-
 Hong Kong
-
 Hungary
-
 India
-
 Indonesia
-
 Iran, Islamic republic
-
 Iraq
-
 Ireland
-
 Israel
-
 Italy
-
 Jamaica
-
 Japan
-
 Jordan
-
 Kazakhstan
-
 Kenya
-
 Korea
-
 Kuwait
-
 Kyrgyzstan
-
 Laos
-
 Latvia
-
 Lebanon
-
 Lesotho
-
 Libya
-
 Lithuania
-
 Luxembourg
-
 Madagascar
-
 Malaysia
-
 Malta
-
 Mauritius
-
 Mexico
-
 Moldova
-
 Mongolia
-
 Montenegro
-
 Morocco
-
 Mozambique
-
 Myanmar
-
 Namibia
-
 Nepal
-
 Netherlands
-
 New Zealand
-
 Nigeria
-
 North Macedonia
-
 Norway
-
 Oman
-
 Pakistan
-
 Palestine
-
 Panama
-
 Papua New Guinea
-
 Paraguay
-
 Peru
-
 Philippines
-
 Poland
-
 Portugal
-
 Puerto Rico
-
 Qatar
-
 Reunion
-
 Romania
-
 Rwanda
-
 Saudi Arabia
-
 Serbia
-
 Singapore
-
 Slovakia
-
 Slovenia
-
 Somalia
-
 South Africa
-
 Spain
-
 Sri Lanka
-
 Sweden
-
 Switzerland
-
 Syria
-
 Taiwan
-
 Tajikistan
-
 Tanzania
-
 Thailand
-
 Trinidad and Tobago
-
 Tunisia
-
 Turkey
-
 UAE
-
 Uganda
-
 Ukraine
-
 United Kingdom
-
United States
-
 Uruguay
-
 Uzbekistan
-
 Venezuela
-
 Vietnam
-
 Yemen
-
 Zambia
-
 Zimbabwe
- Forex
- Crypto












