

What's behind Stellar's latest 9.3% price pullback?

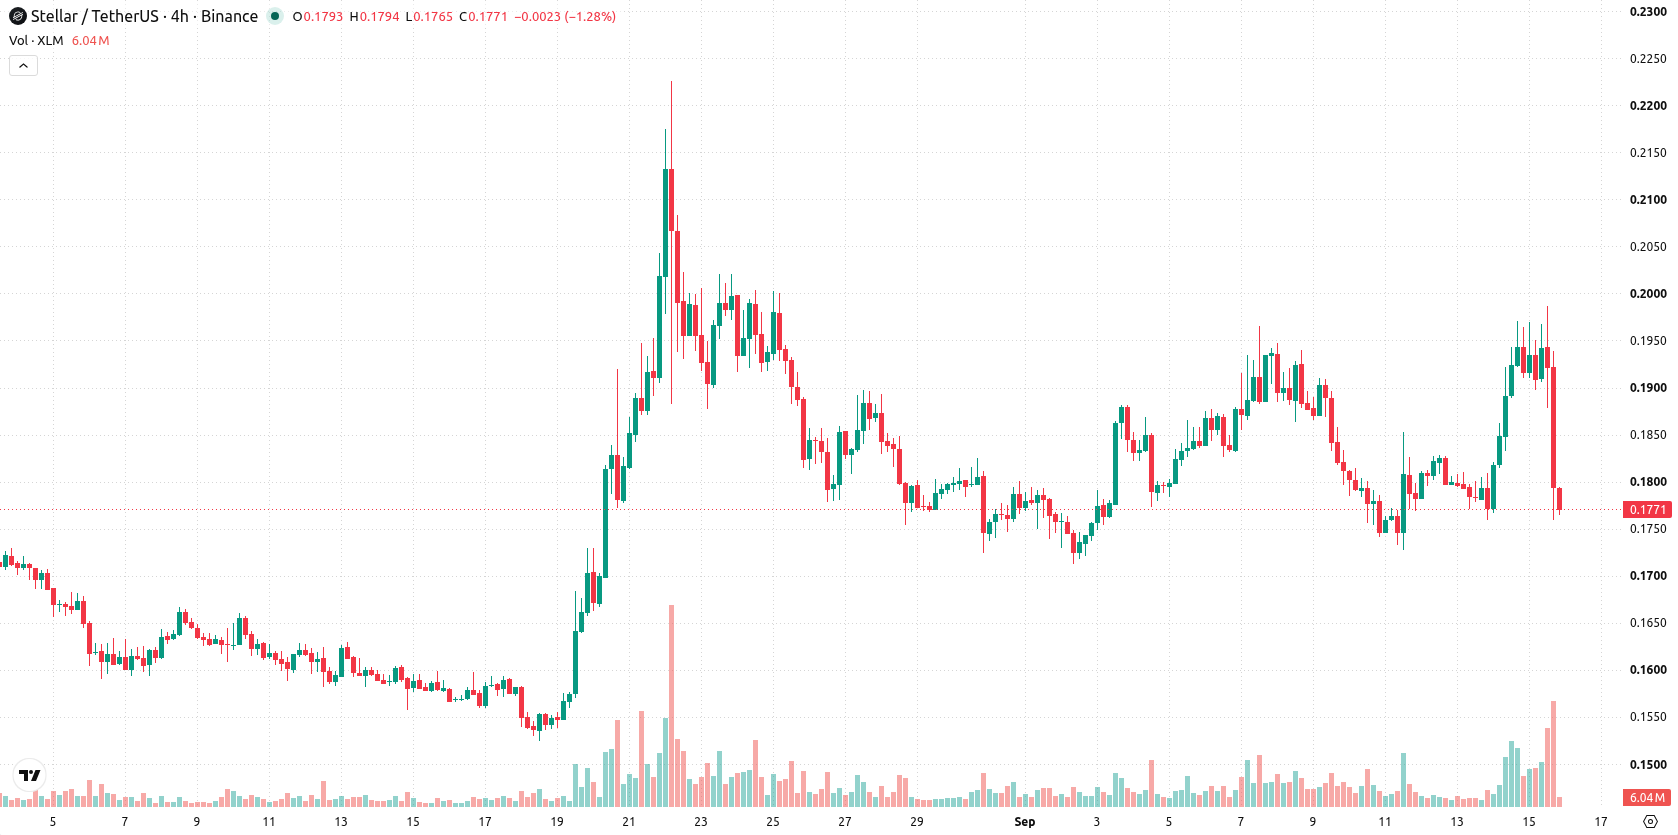
Stellar (XLM) slumped 9.32% after an early downside gap, as traders moved to reduce exposure even as anticipation for the Protocol 28 mainnet upgrade and recent institutional partnerships drew attention to the asset. The drop is reinforced by the loss of the short-term 20-day moving average, confirming ongoing selling pressure despite a still-constructive structure on higher timeframes.
 0.1488
0.1711
Highlights
- Stellar trading activity and open interest surged ahead of the Protocol 28 mainnet upgrade vote, which proposes smart contract and validator system enhancements.
- Recent pilot projects with US Bank and MoneyGram explored stablecoin payment solutions on the Stellar network, and new US regulatory language specifically referenced XLM.
- XLM/USD remains above key medium- and long-term moving averages despite dropping 9.32% on the day, with a projected five-day range of $0.1649 to $0.1893 and a higher probability of an upward move.
Volume surges and regulatory focus as upgrade vote nears
Stellar recorded a sharp increase in trading volume and open interest ahead of the Protocol 28 mainnet upgrade vote, which introduces Soroban smart contract improvements and validator modifications. Recent pilot programs involving US Bank and MoneyGram aimed at leveraging the Stellar network for stablecoin payments were reported. Regulatory developments in the US, including the CLARITY Act's mention of XLM, further highlighted the asset within the digital asset legal landscape, though price action has remained under broader selling pressure.
Short-term selling pressure as mixed momentum meets resistance
XLM/USD has dropped below the 20-day moving average at $0.1819, but remains above both the 50-day ($0.1751) and 200-day ($0.1757) moving averages. This configuration signals short-term pressure from sellers, although underlying medium- and long-term trends remain constructive; the near-term ceiling sits at $0.1819 and the immediate support is at $0.1759. The Ichimoku Kijun at $0.1945 confirms resistance further above, and the overall alignment between the 50-day and 200-day moving averages reflects a bearish long-term structure. Momentum signals are mixed: MACD and Average Directional Index (ADX) both indicate ongoing bullish momentum, whereas the Relative Strength Index (RSI) stands at 59.1, suggesting a neutral-to-bullish bias. Both Stochastic RSI and Commodity Channel Index (CCI) point to an overbought condition. Bull/Bear Power (BBP) is positive at 0.0145, indicating buyers dominate intraday action, but overbought readings in Stochastic RSI and CCI warn of possible short-term exhaustion. The pair is trading at $0.1771 after an early downside gap of approximately 1.89% and a drop of 9.32% on the day, currently positioned near the intraday low. Intraday volatility amplitude is high at 12.96%. The tone suggests continued selling pressure following the open, with mixed oscillator readings cautioning against chasing momentum at current levels.
Earlier, analysts noted that Stella's downside bias was driven by continued selling pressure despite institutional engagement and scheduled protocol upgrades. The current outlook further strengthens this view, with short-term technicals reinforcing a cautious stance as traders should closely watch for a decisive move outside the $0.1649–$0.1893 volatility range.










-
 Afghanistan
-
 Albania
-
 Algeria
-
 Angola
-
 Argentina
-
 Armenia
-
 Australia
-
 Austria
-
 Azerbaijan
-
 Bahamas
-
 Bahrain
-
 Bangladesh
-
 Belarus
-
 Belgium
-
 Bolivia
-
 Botswana
-
 Brazil
-
 Brunei
-
 Bulgaria
-
 Cambodia
-
 Cameroon
-
 Canada
-
 Chile
-
 China
-
 Colombia
-
 Congo
-
 Costa Rica
-
 Cote d'Ivoire
-
 Croatia
-
 Cuba
-
 Cyprus
-
 Czechia
-
 DR Congo
-
 Denmark
-
 Dominican Republic
-
 Ecuador
-
 Egypt
-
 El Salvador
-
 Estonia
-
 Eswatini
-
 Ethiopia
-
 Finland
-
 France
-
 Georgia
-
 Germany
-
 Ghana
-
 Greece
-
 Haiti
-
 Hong Kong
-
 Hungary
-
 India
-
 Indonesia
-
 Iran, Islamic republic
-
 Iraq
-
 Ireland
-
 Israel
-
 Italy
-
 Jamaica
-
 Japan
-
 Jordan
-
 Kazakhstan
-
 Kenya
-
 Korea
-
 Kuwait
-
 Kyrgyzstan
-
 Laos
-
 Latvia
-
 Lebanon
-
 Lesotho
-
 Libya
-
 Lithuania
-
 Luxembourg
-
 Madagascar
-
 Malaysia
-
 Malta
-
 Mauritius
-
 Mexico
-
 Moldova
-
 Mongolia
-
 Montenegro
-
 Morocco
-
 Mozambique
-
 Myanmar
-
 Namibia
-
 Nepal
-
 Netherlands
-
 New Zealand
-
 Nigeria
-
 North Macedonia
-
 Norway
-
 Oman
-
 Pakistan
-
 Palestine
-
 Panama
-
 Papua New Guinea
-
 Paraguay
-
 Peru
-
 Philippines
-
 Poland
-
 Portugal
-
 Puerto Rico
-
 Qatar
-
 Reunion
-
 Romania
-
 Rwanda
-
 Saudi Arabia
-
 Serbia
-
 Singapore
-
 Slovakia
-
 Slovenia
-
 Somalia
-
 South Africa
-
 Spain
-
 Sri Lanka
-
 Sweden
-
 Switzerland
-
 Syria
-
 Taiwan
-
 Tajikistan
-
 Tanzania
-
 Thailand
-
 Trinidad and Tobago
-
 Tunisia
-
 Turkey
-
 UAE
-
 Uganda
-
 Ukraine
-
 United Kingdom
-
United States
-
 Uruguay
-
 Uzbekistan
-
 Venezuela
-
 Vietnam
-
 Yemen
-
 Zambia
-
 Zimbabwe
- Forex
- Crypto












