


Dash (DASH) is trading at $58.76 after a steep daily drop of 7.42%. The asset currently sits below its short- and medium-term moving averages, while holding above key longer-term averages.
 194.69
196.14
Highlights
- Dash increased its exposure in Asia by participating in Korea Blockchain Week 2026, expanding network visibility among regional industry players.
- Open interest in Dash futures has grown, signaling heightened trading engagement and deeper liquidity, though ongoing broad selling pressure persists.
- DASH/USD faces strong intraday selling pressure with all key indicators negative and price expected to range between $55.31 and $62.21 in the next 2 to 3 days.
Industry exposure and futures interest rise as price lags sentiment
Dash took part in Korea Blockchain Week 2026, increasing its exposure among industry participants in the region, according to Tronweekly. This event has expanded the network's visibility and may draw further institutional and developer attention over time. Additionally, open interest in Dash futures has been rising, pointing to deeper trading engagement and liquidity in recent sessions. These developments have improved fundamentals, though price action has remained under broader selling pressure.
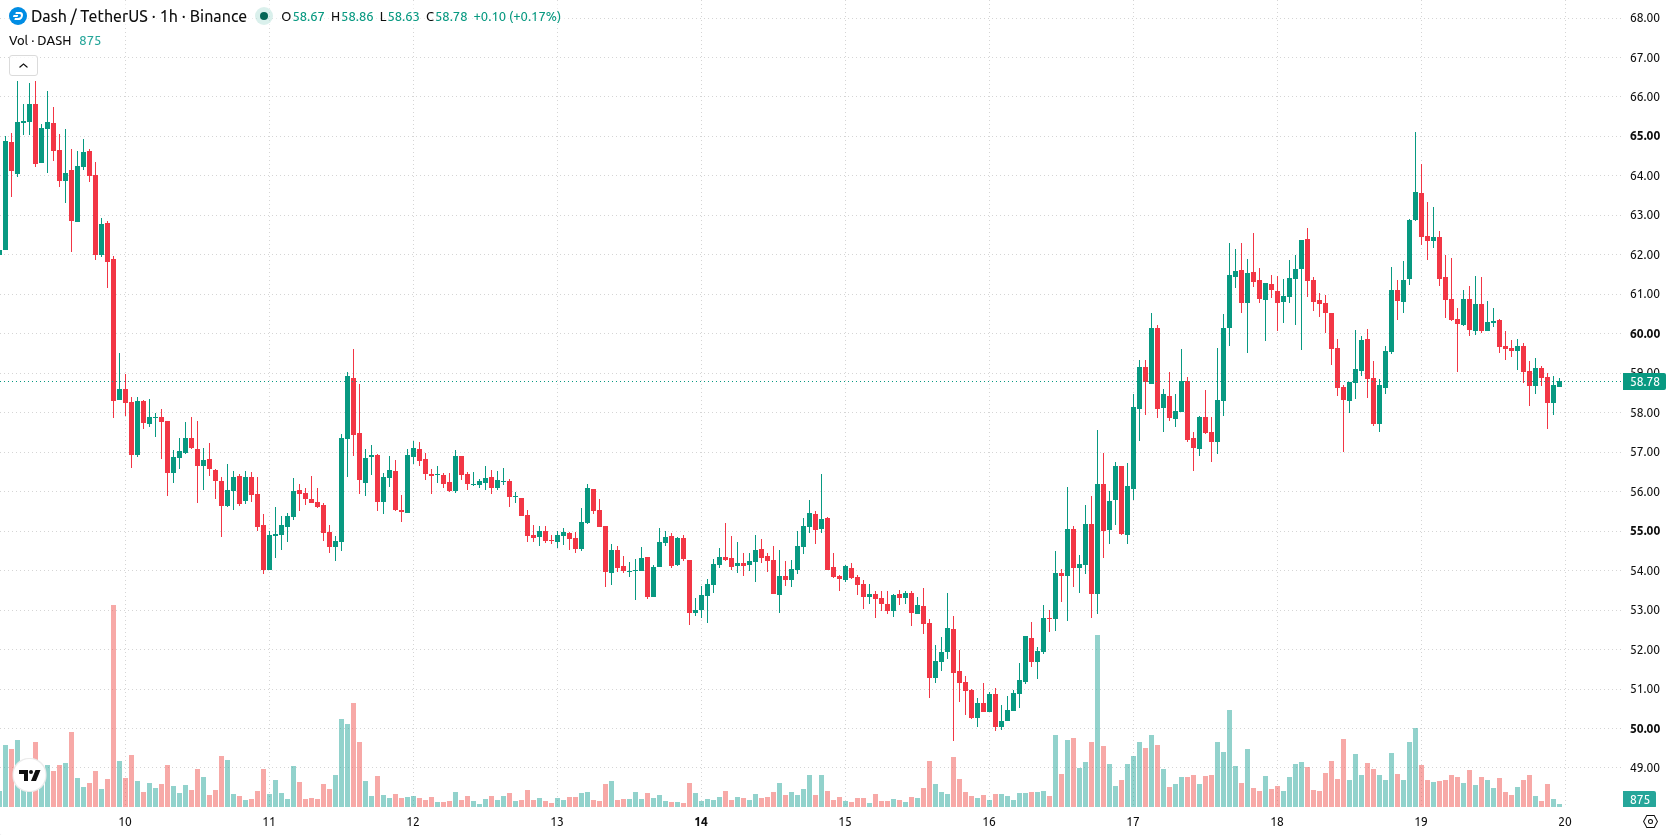
Resistance holds amid broad oversold signals and heightened volatility
DASH/USD trades below the MA-20 at $59.8 and MA-50 at $60.32 on the hourly chart, but remains well above the long-term MA-200 at $37.94. The immediate resistance level is defined by the daily Ichimoku Kijun at $61.33. Momentum indicators are negative, with MACD and Awesome Oscillator supporting a sell bias, while ADX remains neutral, reflecting non-decisive trend strength. RSI, Stochastic RSI, CCI, and Bull/Bear Power all confirm oversold conditions and dominance of sellers on the intraday timeframe. Volatility is elevated as the price holds near today's low.
Downside risk prevailing as price hovers near key support band
Looking ahead, the expected DASH/USD trading range over the next 2 to 3 days is $55.31 to $62.21, reflecting typical volatility relative to current levels. Statistical probabilities favor a further decline, with a 52% likelihood of downside versus 48% for an upward rebound. The baseline scenario anticipates price consolidation within this band; a bullish reversal would require a close above $61.33, while a decisive break below $55.31 could accelerate selling and test lower supports.
Previously it was reported that Dash was demonstrating persistent bullish momentum supported by robust trading activity and technical alignment. The current shift in momentum, marked by a break below short-term moving averages and increased volatility, introduces a downside bias, making the $55.31 support level a key area to monitor for further price action.









-
 Afghanistan
-
 Albania
-
 Algeria
-
 Angola
-
 Argentina
-
 Armenia
-
 Australia
-
 Austria
-
 Azerbaijan
-
 Bahamas
-
 Bahrain
-
 Bangladesh
-
 Belarus
-
 Belgium
-
 Bolivia
-
 Botswana
-
 Brazil
-
 Brunei
-
 Bulgaria
-
 Cambodia
-
 Cameroon
-
 Canada
-
 Chile
-
 China
-
 Colombia
-
 Congo
-
 Costa Rica
-
 Cote d'Ivoire
-
 Croatia
-
 Cuba
-
 Cyprus
-
 Czechia
-
 DR Congo
-
 Denmark
-
 Dominican Republic
-
 Ecuador
-
 Egypt
-
 El Salvador
-
 Estonia
-
 Eswatini
-
 Ethiopia
-
 Finland
-
 France
-
 Georgia
-
 Germany
-
 Ghana
-
 Greece
-
 Haiti
-
 Hong Kong
-
 Hungary
-
 India
-
 Indonesia
-
 Iran, Islamic republic
-
 Iraq
-
 Ireland
-
 Israel
-
 Italy
-
 Jamaica
-
 Japan
-
 Jordan
-
 Kazakhstan
-
 Kenya
-
 Korea
-
 Kuwait
-
 Kyrgyzstan
-
 Laos
-
 Latvia
-
 Lebanon
-
 Lesotho
-
 Libya
-
 Lithuania
-
 Luxembourg
-
 Madagascar
-
 Malaysia
-
 Malta
-
 Mauritius
-
 Mexico
-
 Moldova
-
 Mongolia
-
 Montenegro
-
 Morocco
-
 Mozambique
-
 Myanmar
-
 Namibia
-
 Nepal
-
 Netherlands
-
 New Zealand
-
 Nigeria
-
 North Macedonia
-
 Norway
-
 Oman
-
 Pakistan
-
 Palestine
-
 Panama
-
 Papua New Guinea
-
 Paraguay
-
 Peru
-
 Philippines
-
 Poland
-
 Portugal
-
 Puerto Rico
-
 Qatar
-
 Reunion
-
 Romania
-
 Rwanda
-
 Saudi Arabia
-
 Serbia
-
 Singapore
-
 Slovakia
-
 Slovenia
-
 Somalia
-
 South Africa
-
 Spain
-
 Sri Lanka
-
 Sweden
-
 Switzerland
-
 Syria
-
 Taiwan
-
 Tajikistan
-
 Tanzania
-
 Thailand
-
 Trinidad and Tobago
-
 Tunisia
-
 Turkey
-
 UAE
-
 Uganda
-
 Ukraine
-
 United Kingdom
-
United States
-
 Uruguay
-
 Uzbekistan
-
 Venezuela
-
 Vietnam
-
 Yemen
-
 Zambia
-
 Zimbabwe
- Forex
- Crypto












