


Plasma (XPL) is trading at $0.0941, down 8.34% on the day. The token is currently situated below its key moving averages, consistent with broad downside pressure in the short and medium term.
 0.0465
0.0513
Highlights
- Plasma plans to release 1.76 billion XPL tokens worth about $159.9 million on September 25, 2026, mainly to early investors and core growth funds.
- Two holders will receive most unlocked tokens, increasing distribution concentration and raising concerns about potential sell pressure and market instability as the unlock date approaches.
- XPL trades below key moving averages with negative short-term momentum, a forecast range of $0.0881 to $0.1001, and a 65% probability of further downside.
Supply expansion risk as major token unlock and concentration loom
Plasma is set to unlock 1.76 billion XPL tokens on September 25, 2026, with a total value of approximately $159.9 million, the majority of which will be allocated to early investors and core ecosystem growth funds, according to Coinidol. This planned release will significantly increase the circulating supply, introducing the potential for future sell pressure and liquidity shifts as the unlock nears. Beincrypto reported that most of these tokens will be split between two holders, highlighting a concentration of distribution and linking Plasma’s event to wider token unlock activities across the market. Although these events are scheduled for the future, anticipation of the forthcoming supply expansion can weigh on current sentiment and market stability.
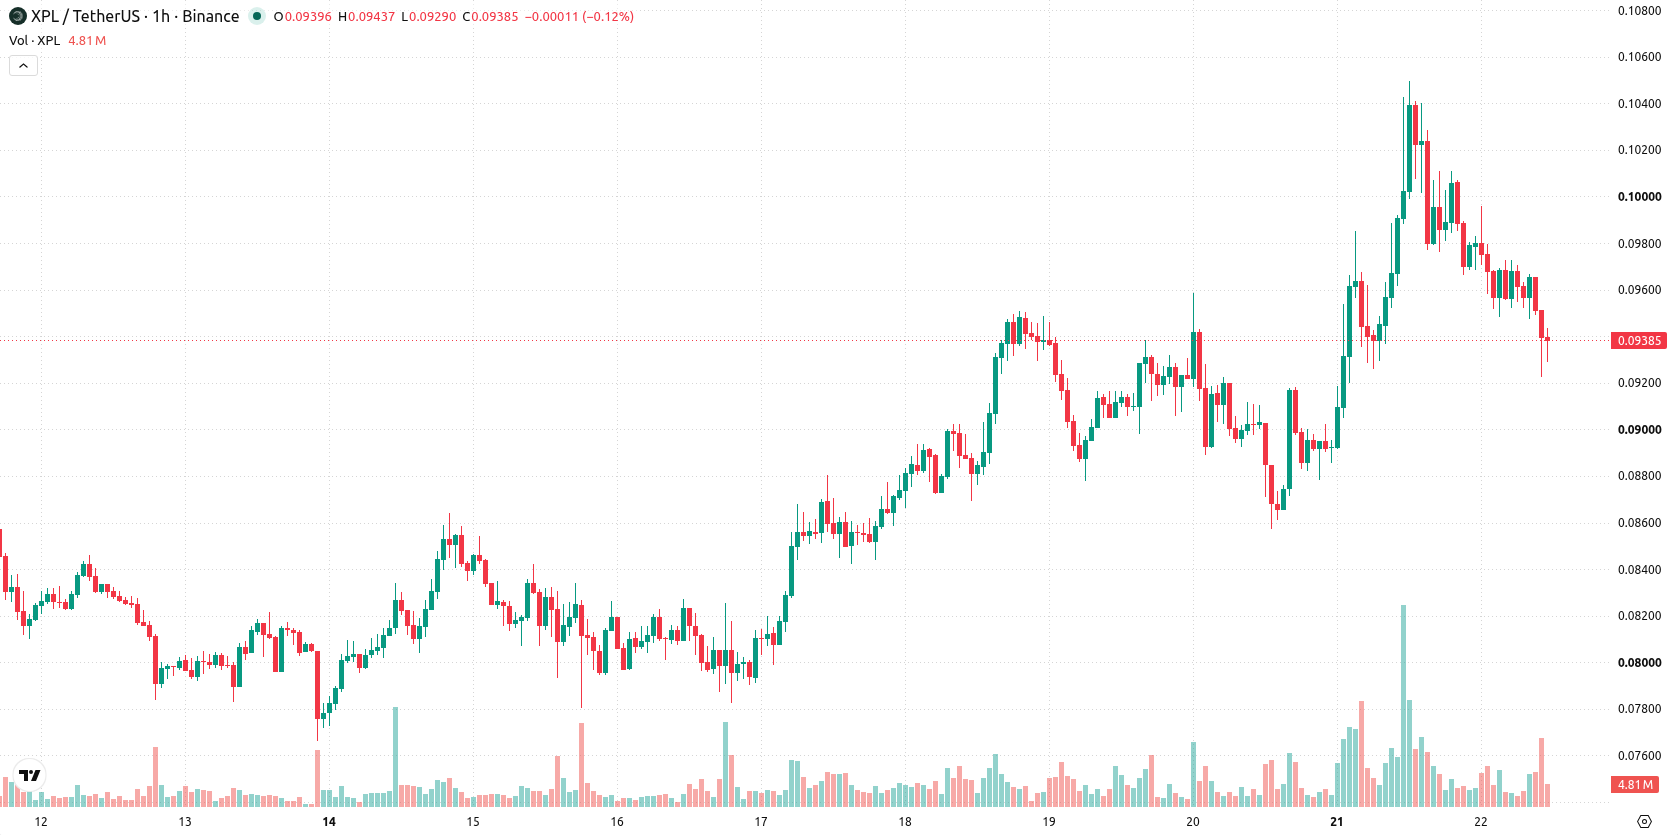
Mixed momentum signals as resistance faces seller control
On the technical front, XPL/USD trades below both the MA-20 and MA-50 levels on the hourly chart, while holding just above the MA-200 on the daily timeframe. The nearest resistance is defined by the Ichimoku Kijun level at $0.0996, with long-term support at $0.0881. Momentum indicators show mixed readings: MACD and ADX remain neutral, RSI and Stoch RSI both signal oversold conditions, and CCI also points to oversold territory. Bull/Bear Power currently indicates seller dominance, with the Awesome Oscillator confirming intraday weakness.
Bearish bias prevails as range holds barring volatility shifts
Looking ahead, the expected range for XPL/USD spans from $0.0881 to $0.1001 in the coming sessions. Downside moves have a higher probability, estimated at 65%, while a potential upward correction is seen at 35%. The baseline scenario sees price remaining within this corridor given typical volatility, with a bullish turn requiring a break above $0.0996 resistance and a bearish extension unfolding if support near $0.0881 is breached.
Earlier, analysts noted that while Plasma showed strong technical momentum, the looming large-scale token unlock presented risks of increased volatility and supply-driven pressure. The current setup reflects a shift towards downside vulnerability, suggesting traders should closely monitor the $0.0881 support level for potential bearish continuation if selling persists.






Latest Plasma News




-
 Afghanistan
-
 Albania
-
 Algeria
-
 Angola
-
 Argentina
-
 Armenia
-
 Australia
-
 Austria
-
 Azerbaijan
-
 Bahamas
-
 Bahrain
-
 Bangladesh
-
 Belarus
-
 Belgium
-
 Bolivia
-
 Botswana
-
 Brazil
-
 Brunei
-
 Bulgaria
-
 Cambodia
-
 Cameroon
-
 Canada
-
 Chile
-
 China
-
 Colombia
-
 Congo
-
 Costa Rica
-
 Cote d'Ivoire
-
 Croatia
-
 Cuba
-
 Cyprus
-
 Czechia
-
 DR Congo
-
 Denmark
-
 Dominican Republic
-
 Ecuador
-
 Egypt
-
 El Salvador
-
 Estonia
-
 Eswatini
-
 Ethiopia
-
 Finland
-
 France
-
 Georgia
-
 Germany
-
 Ghana
-
 Greece
-
 Haiti
-
 Hong Kong
-
 Hungary
-
 India
-
 Indonesia
-
 Iran, Islamic republic
-
 Iraq
-
 Ireland
-
 Israel
-
 Italy
-
 Jamaica
-
 Japan
-
 Jordan
-
 Kazakhstan
-
 Kenya
-
 Korea
-
 Kuwait
-
 Kyrgyzstan
-
 Laos
-
 Latvia
-
 Lebanon
-
 Lesotho
-
 Libya
-
 Lithuania
-
 Luxembourg
-
 Madagascar
-
 Malaysia
-
 Malta
-
 Mauritius
-
 Mexico
-
 Moldova
-
 Mongolia
-
 Montenegro
-
 Morocco
-
 Mozambique
-
 Myanmar
-
 Namibia
-
 Nepal
-
 Netherlands
-
 New Zealand
-
 Nigeria
-
 North Macedonia
-
 Norway
-
 Oman
-
 Pakistan
-
 Palestine
-
 Panama
-
 Papua New Guinea
-
 Paraguay
-
 Peru
-
 Philippines
-
 Poland
-
 Portugal
-
 Puerto Rico
-
 Qatar
-
 Reunion
-
 Romania
-
 Rwanda
-
 Saudi Arabia
-
 Serbia
-
 Singapore
-
 Slovakia
-
 Slovenia
-
 Somalia
-
 South Africa
-
 Spain
-
 Sri Lanka
-
 Sweden
-
 Switzerland
-
 Syria
-
 Taiwan
-
 Tajikistan
-
 Tanzania
-
 Thailand
-
 Trinidad and Tobago
-
 Tunisia
-
 Turkey
-
 UAE
-
 Uganda
-
 Ukraine
-
 United Kingdom
-
United States
-
 Uruguay
-
 Uzbekistan
-
 Venezuela
-
 Vietnam
-
 Yemen
-
 Zambia
-
 Zimbabwe
- Forex
- Crypto












