

Gala support test at $0.00181781: Technical outlook

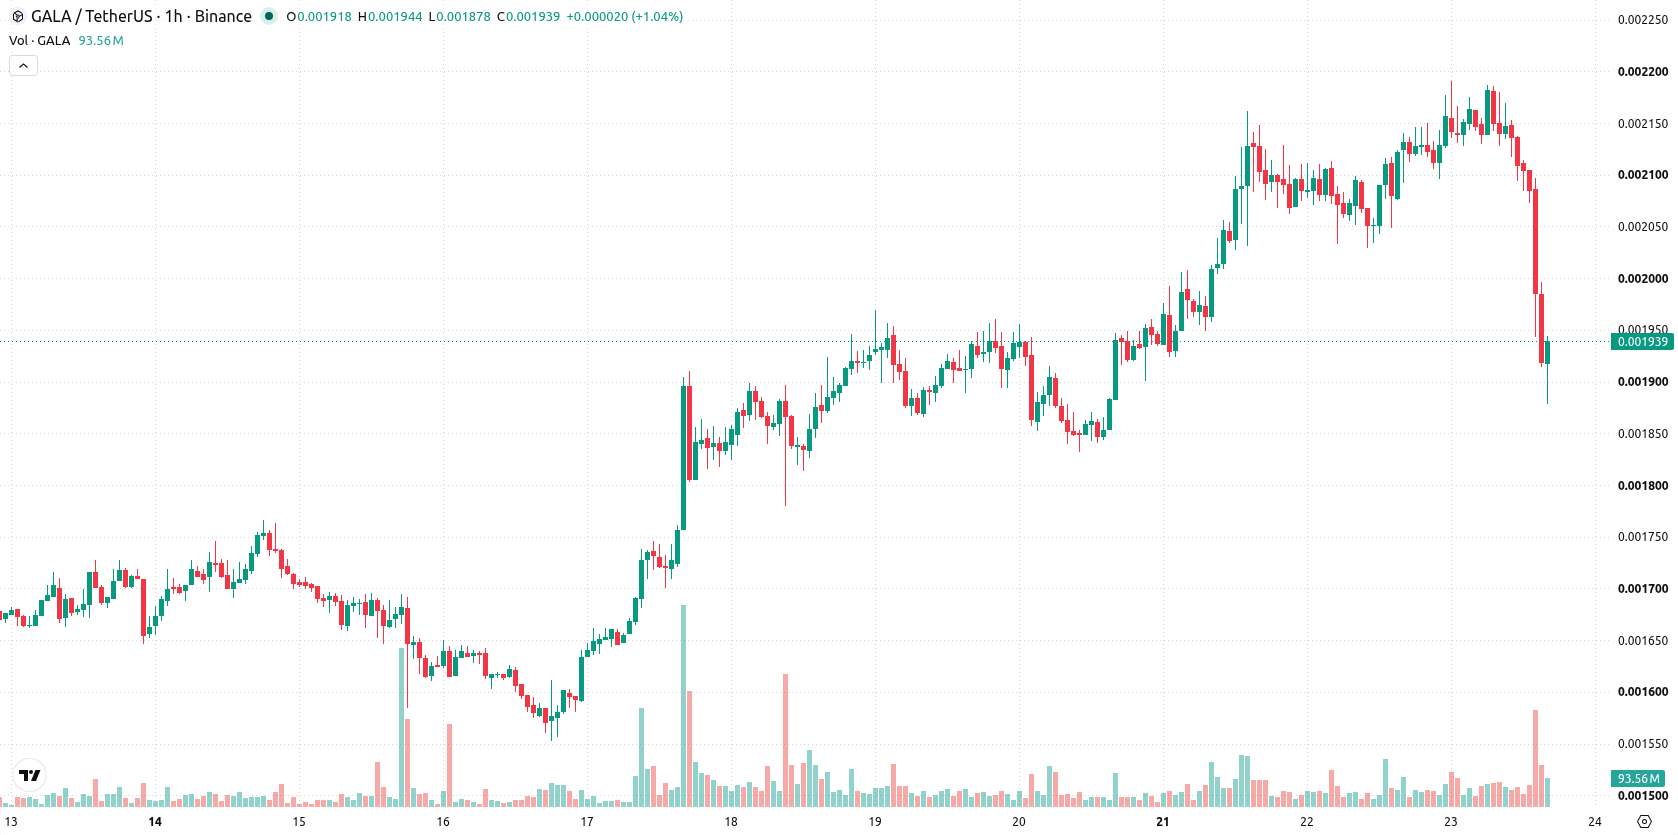
Gala (GALA) is trading at $0.001939, down 7.58% on the day. The price remains below its key moving averages, reflecting persistent seller control in the short, medium, and long term.
 0.001234
0.00144100
Highlights
- GALA trades below major moving averages across short, medium, and long-term timeframes, confirming dominant seller control.
- Oscillators and momentum indicators point to intense bearish bias, but oversold readings indicate possible exhaustion in the downtrend.
- Price is sharply lower today at $0.001939 with a projected 2 to 3 day range of $0.00181781 to $0.002194 and a 79% likelihood of further downside.
Oversold momentum amplifies seller control below technical support
On the h1 chart, GALA is positioned below both its MA-20 and MA-50, while on the daily timeframe, it has also slipped below the MA-200, indicating ongoing seller strength across timeframes. Immediate resistance is defined by the Ichimoku Kijun at $0.002067. Among momentum and oscillators, MACD and the Awesome Oscillator are deemed neutral, but ADX signals that sellers retain control intraday. RSI stands at 28.6, deep in oversold territory, reinforced by both Stoch RSI and CCI also reflecting oversold conditions, highlighting stretched near-term weakness. Bull/Bear Power further confirms seller dominance within intraday trading.
Downside risk persists as range narrows with limited upside potential
Over the next 2 to 3 trading days, GALA is expected to trade within a range of $0.00181781 to $0.002194, marking a volatility band relative to current levels. The probability of an upward price move stands at 21%, while the likelihood of a continued decline is higher at 79%, given prevailing momentum. The base case envisions sideways action within this corridor, while a move above $0.002067 resistance could trigger a bullish reversal. Conversely, a break below $0.00181781 would expose the asset to further downside.
Earlier, analysts noted that Gala’s price action was constrained by longer-term resistance despite periodic short-term strength. The current technical setup signals a shift in control to sellers, with the outlook now focused on whether GALA can avoid further downside by holding above $0.00181781 support.






Latest Gala News





-
 Afghanistan
-
 Albania
-
 Algeria
-
 Angola
-
 Argentina
-
 Armenia
-
 Australia
-
 Austria
-
 Azerbaijan
-
 Bahamas
-
 Bahrain
-
 Bangladesh
-
 Belarus
-
 Belgium
-
 Bolivia
-
 Botswana
-
 Brazil
-
 Brunei
-
 Bulgaria
-
 Cambodia
-
 Cameroon
-
 Canada
-
 Chile
-
 China
-
 Colombia
-
 Congo
-
 Costa Rica
-
 Cote d'Ivoire
-
 Croatia
-
 Cuba
-
 Cyprus
-
 Czechia
-
 DR Congo
-
 Denmark
-
 Dominican Republic
-
 Ecuador
-
 Egypt
-
 El Salvador
-
 Estonia
-
 Eswatini
-
 Ethiopia
-
 Finland
-
 France
-
 Georgia
-
 Germany
-
 Ghana
-
 Greece
-
 Haiti
-
 Hong Kong
-
 Hungary
-
 India
-
 Indonesia
-
 Iran, Islamic republic
-
 Iraq
-
 Ireland
-
 Israel
-
 Italy
-
 Jamaica
-
 Japan
-
 Jordan
-
 Kazakhstan
-
 Kenya
-
 Korea
-
 Kuwait
-
 Kyrgyzstan
-
 Laos
-
 Latvia
-
 Lebanon
-
 Lesotho
-
 Libya
-
 Lithuania
-
 Luxembourg
-
 Madagascar
-
 Malaysia
-
 Malta
-
 Mauritius
-
 Mexico
-
 Moldova
-
 Mongolia
-
 Montenegro
-
 Morocco
-
 Mozambique
-
 Myanmar
-
 Namibia
-
 Nepal
-
 Netherlands
-
 New Zealand
-
 Nigeria
-
 North Macedonia
-
 Norway
-
 Oman
-
 Pakistan
-
 Palestine
-
 Panama
-
 Papua New Guinea
-
 Paraguay
-
 Peru
-
 Philippines
-
 Poland
-
 Portugal
-
 Puerto Rico
-
 Qatar
-
 Reunion
-
 Romania
-
 Rwanda
-
 Saudi Arabia
-
 Serbia
-
 Singapore
-
 Slovakia
-
 Slovenia
-
 Somalia
-
 South Africa
-
 Spain
-
 Sri Lanka
-
 Sweden
-
 Switzerland
-
 Syria
-
 Taiwan
-
 Tajikistan
-
 Tanzania
-
 Thailand
-
 Trinidad and Tobago
-
 Tunisia
-
 Turkey
-
 UAE
-
 Uganda
-
 Ukraine
-
 United Kingdom
-
United States
-
 Uruguay
-
 Uzbekistan
-
 Venezuela
-
 Vietnam
-
 Yemen
-
 Zambia
-
 Zimbabwe
- Forex
- Crypto












