

Floki Inu drops more than 11% after price slips to session lows despite bullish momentum signals

Floki Inu (FLOKI) slid 11.27% today as sellers dominated, driving the price below intraday support and intensifying downside pressure. The move is supported by an intraday volatility spike and the price falling to session lows, even as major moving averages still signal underlying bullish momentum.
 0.0000182
0.00002089
Highlights
- FLOKI/USD trades above major moving averages, indicating ongoing upward momentum over all key timeframes.
- Buy signals dominate among momentum indicators, but the Commodity Channel Index flags overbought conditions and Stochastic RSI signals a strong sell.
- Price holds near $0.0000271 with support at $0.0000269 and expected five-day range of $0.00002375 to $0.0000331.
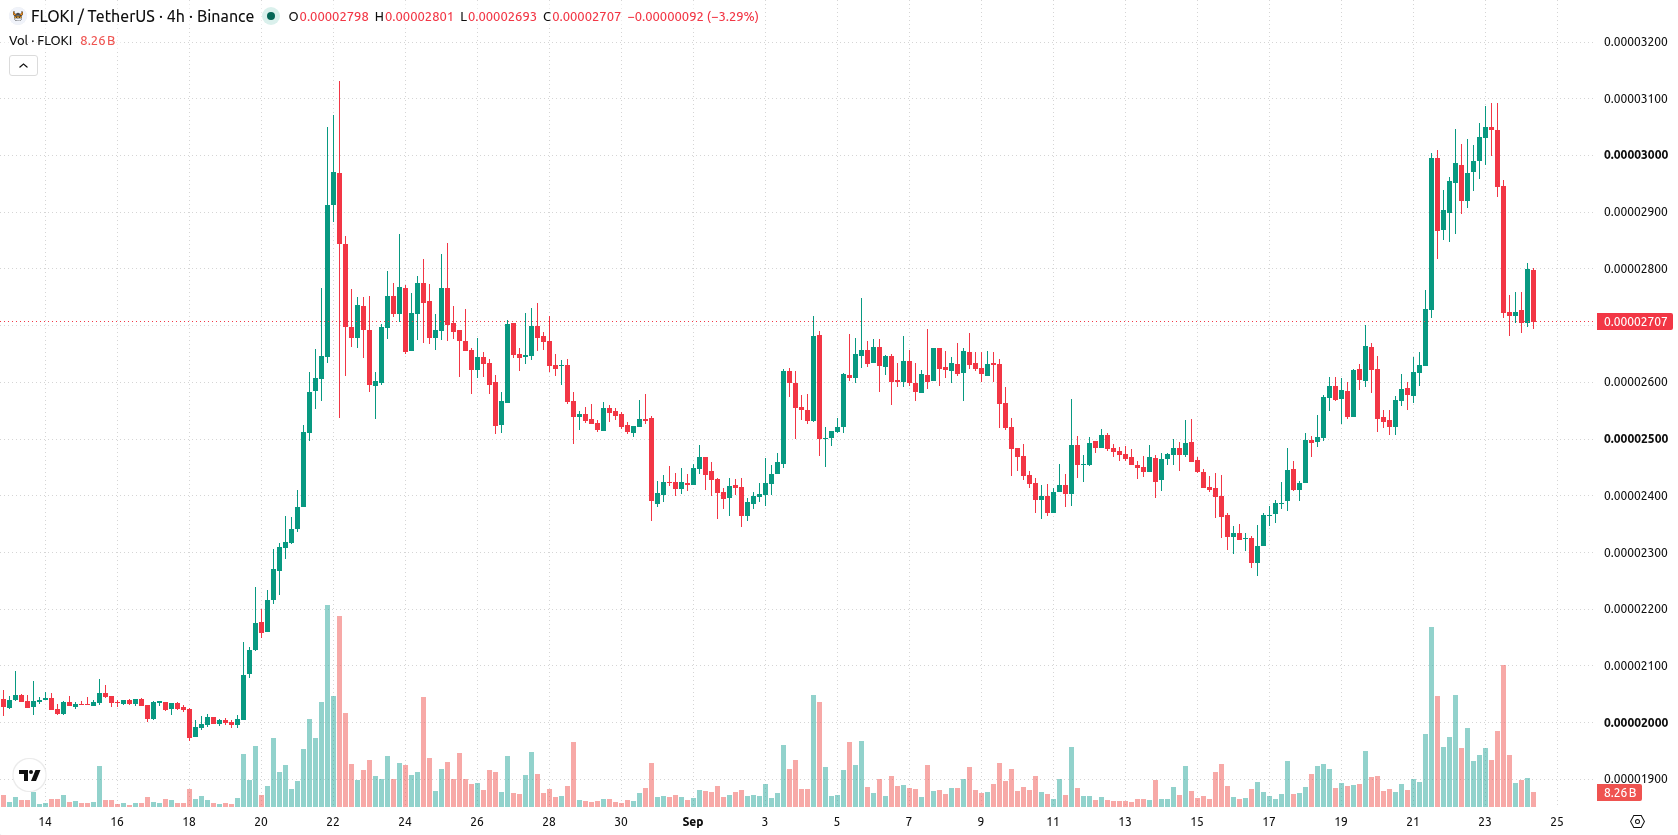
Momentum divergence as bullish structure meets overbought warning
FLOKI/USD has climbed above its 20-day, 50-day, and 200-day moving averages at $0.00002562, $0.00002418, and $0.00002648, indicating a bullish structure in short, medium, and long-term trends. The Ichimoku Kijun is at $0.00002675, acting as support, while key levels are defined by a near-term floor at $0.0000269 and resistance at $0.000028. Momentum readings remain largely constructive: MACD and ADX both generate buy signals, with the RSI rising toward a buy bias. However, the CCI flags overbought conditions, and Stochastic RSI registers a strong sell, creating a notable divergence with other momentum indicators. The Awesome Oscillator supports a bullish outlook, while BBP indicates buyers are still in control intraday. The price is positioned near the session low after a downside gap, and intraday volatility is measured at 4.09%.
Earlier, analysts noted that Floki's recent rally had exposed the token to heightened volatility and increased risk of a short-term reversal. The latest move lower reinforces this caution, with current volatility bands indicating traders should closely monitor the $0.0000269 support as a key level that may define the next directional move.










-
 Afghanistan
-
 Albania
-
 Algeria
-
 Angola
-
 Argentina
-
 Armenia
-
 Australia
-
 Austria
-
 Azerbaijan
-
 Bahamas
-
 Bahrain
-
 Bangladesh
-
 Belarus
-
 Belgium
-
 Bolivia
-
 Botswana
-
 Brazil
-
 Brunei
-
 Bulgaria
-
 Cambodia
-
 Cameroon
-
 Canada
-
 Chile
-
 China
-
 Colombia
-
 Congo
-
 Costa Rica
-
 Cote d'Ivoire
-
 Croatia
-
 Cuba
-
 Cyprus
-
 Czechia
-
 DR Congo
-
 Denmark
-
 Dominican Republic
-
 Ecuador
-
 Egypt
-
 El Salvador
-
 Estonia
-
 Eswatini
-
 Ethiopia
-
 Finland
-
 France
-
 Georgia
-
 Germany
-
 Ghana
-
 Greece
-
 Haiti
-
 Hong Kong
-
 Hungary
-
 India
-
 Indonesia
-
 Iran, Islamic republic
-
 Iraq
-
 Ireland
-
 Israel
-
 Italy
-
 Jamaica
-
 Japan
-
 Jordan
-
 Kazakhstan
-
 Kenya
-
 Korea
-
 Kuwait
-
 Kyrgyzstan
-
 Laos
-
 Latvia
-
 Lebanon
-
 Lesotho
-
 Libya
-
 Lithuania
-
 Luxembourg
-
 Madagascar
-
 Malaysia
-
 Malta
-
 Mauritius
-
 Mexico
-
 Moldova
-
 Mongolia
-
 Montenegro
-
 Morocco
-
 Mozambique
-
 Myanmar
-
 Namibia
-
 Nepal
-
 Netherlands
-
 New Zealand
-
 Nigeria
-
 North Macedonia
-
 Norway
-
 Oman
-
 Pakistan
-
 Palestine
-
 Panama
-
 Papua New Guinea
-
 Paraguay
-
 Peru
-
 Philippines
-
 Poland
-
 Portugal
-
 Puerto Rico
-
 Qatar
-
 Reunion
-
 Romania
-
 Rwanda
-
 Saudi Arabia
-
 Serbia
-
 Singapore
-
 Slovakia
-
 Slovenia
-
 Somalia
-
 South Africa
-
 Spain
-
 Sri Lanka
-
 Sweden
-
 Switzerland
-
 Syria
-
 Taiwan
-
 Tajikistan
-
 Tanzania
-
 Thailand
-
 Trinidad and Tobago
-
 Tunisia
-
 Turkey
-
 UAE
-
 Uganda
-
 Ukraine
-
 United Kingdom
-
United States
-
 Uruguay
-
 Uzbekistan
-
 Venezuela
-
 Vietnam
-
 Yemen
-
 Zambia
-
 Zimbabwe
- Forex
- Crypto












