

The Graph price holds near $0.02269977 support as sellers control short-term trend

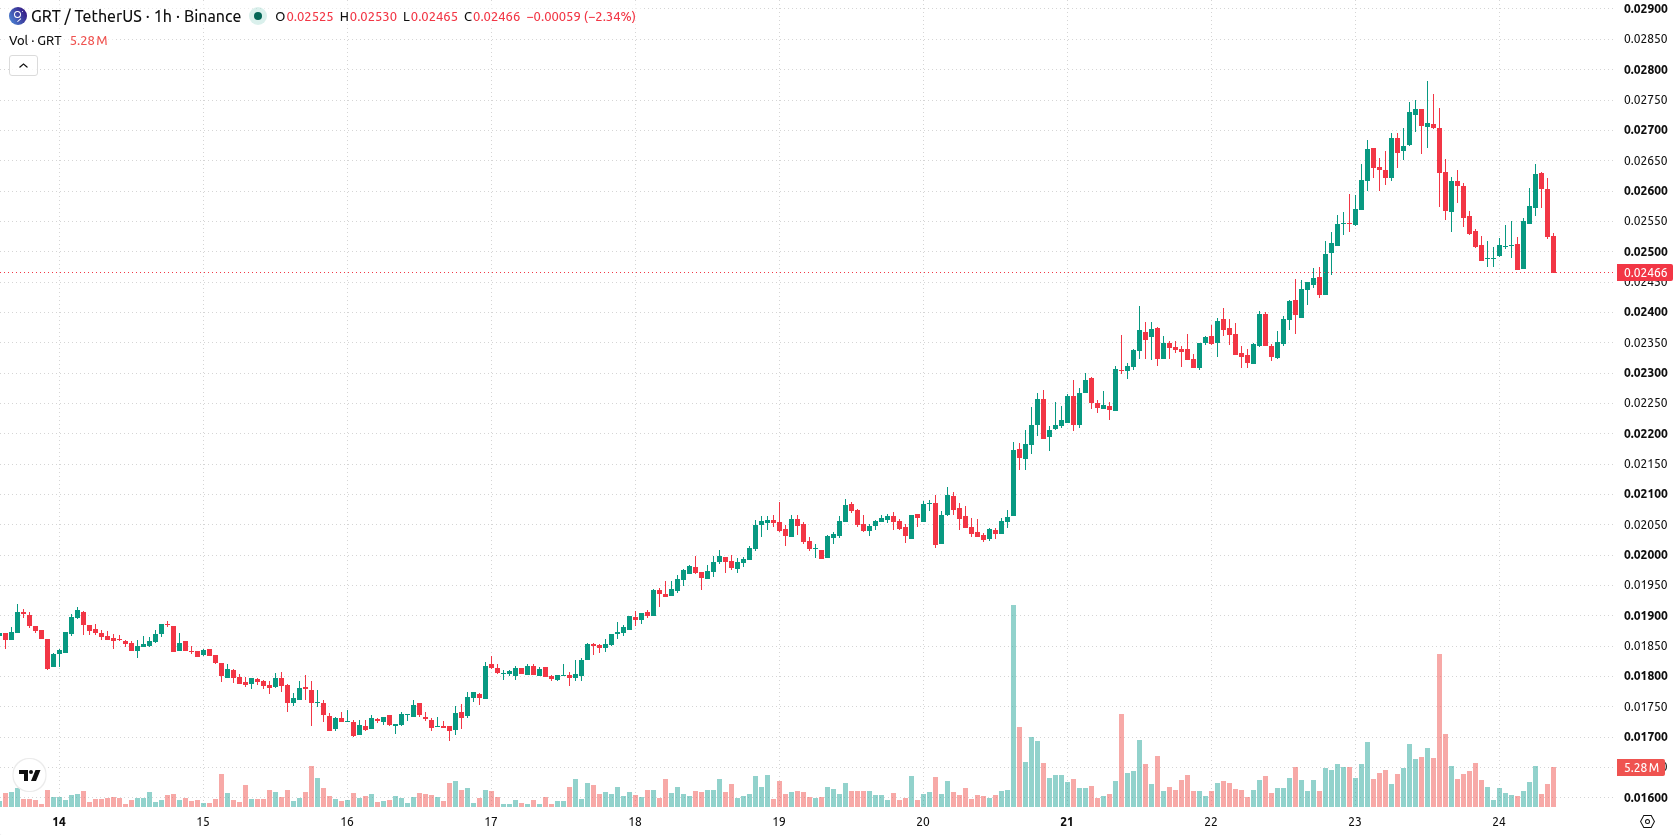
The Graph (GRT) is trading at $0.02471, down 9.09% for the day. The asset is currently positioned below its key moving averages, highlighting prevailing negative momentum.
 0.02126
0.02362000
Highlights
- GRT/USD trades below key short- and medium-term moving averages, indicating persistent downward pressure from sellers.
- Technical indicators are mixed, with momentum signals split and recent daily losses of 9.09% showing significant volatility.
- Expected price range for the next 2 to 3 days is $0.02269977 to $0.02724, with a 53% chance of an upward move and consolidation likely.
Mixed technical signals as mid-term pressure meets longer-term support
On the technical side, GRT/USD is trading below the MA-20 and MA-50 on the h1 chart, reflecting continued short- and medium-term selling pressure. However, the price remains above the MA-200 on the daily timeframe, indicating ongoing longer-term support, while immediate resistance is marked by the Ichimoku Kijun at $0.026255. Among momentum signals, MACD and Stochastic RSI are neutral, whereas ADX indicates a possible trend initiation to the upside. The RSI and CCI both suggest buying opportunities, aligning with near-term oversold conditions, while Bull/Bear Power shows intraday buyer dominance despite notable price volatility.
Bullish bias edges out as volatility band guides near-term outlook
Looking ahead, GRT is expected to consolidate within a typical volatility band of $0.02269977 to $0.02724 over the next 2–3 trading days. There is a slightly higher probability (53%) of an upward move, making sustained declines less likely in the immediate term. If price breaks above the $0.026255 resistance, a bullish extension may follow, while a drop below $0.02269977 could open the way to deeper losses.
Earlier, analysts noted that The Graph was demonstrating strong bullish technical momentum with buyers in firm control. However, the current market setup indicates a shift toward consolidation following recent declines, making the $0.026255 resistance a critical level for traders to monitor as a potential trigger for renewed upside momentum.






Latest GRT News





-
 Afghanistan
-
 Albania
-
 Algeria
-
 Angola
-
 Argentina
-
 Armenia
-
 Australia
-
 Austria
-
 Azerbaijan
-
 Bahamas
-
 Bahrain
-
 Bangladesh
-
 Belarus
-
 Belgium
-
 Bolivia
-
 Botswana
-
 Brazil
-
 Brunei
-
 Bulgaria
-
 Cambodia
-
 Cameroon
-
 Canada
-
 Chile
-
 China
-
 Colombia
-
 Congo
-
 Costa Rica
-
 Cote d'Ivoire
-
 Croatia
-
 Cuba
-
 Cyprus
-
 Czechia
-
 DR Congo
-
 Denmark
-
 Dominican Republic
-
 Ecuador
-
 Egypt
-
 El Salvador
-
 Estonia
-
 Eswatini
-
 Ethiopia
-
 Finland
-
 France
-
 Georgia
-
 Germany
-
 Ghana
-
 Greece
-
 Haiti
-
 Hong Kong
-
 Hungary
-
 India
-
 Indonesia
-
 Iran, Islamic republic
-
 Iraq
-
 Ireland
-
 Israel
-
 Italy
-
 Jamaica
-
 Japan
-
 Jordan
-
 Kazakhstan
-
 Kenya
-
 Korea
-
 Kuwait
-
 Kyrgyzstan
-
 Laos
-
 Latvia
-
 Lebanon
-
 Lesotho
-
 Libya
-
 Lithuania
-
 Luxembourg
-
 Madagascar
-
 Malaysia
-
 Malta
-
 Mauritius
-
 Mexico
-
 Moldova
-
 Mongolia
-
 Montenegro
-
 Morocco
-
 Mozambique
-
 Myanmar
-
 Namibia
-
 Nepal
-
 Netherlands
-
 New Zealand
-
 Nigeria
-
 North Macedonia
-
 Norway
-
 Oman
-
 Pakistan
-
 Palestine
-
 Panama
-
 Papua New Guinea
-
 Paraguay
-
 Peru
-
 Philippines
-
 Poland
-
 Portugal
-
 Puerto Rico
-
 Qatar
-
 Reunion
-
 Romania
-
 Rwanda
-
 Saudi Arabia
-
 Serbia
-
 Singapore
-
 Slovakia
-
 Slovenia
-
 Somalia
-
 South Africa
-
 Spain
-
 Sri Lanka
-
 Sweden
-
 Switzerland
-
 Syria
-
 Taiwan
-
 Tajikistan
-
 Tanzania
-
 Thailand
-
 Trinidad and Tobago
-
 Tunisia
-
 Turkey
-
 UAE
-
 Uganda
-
 Ukraine
-
 United Kingdom
-
United States
-
 Uruguay
-
 Uzbekistan
-
 Venezuela
-
 Vietnam
-
 Yemen
-
 Zambia
-
 Zimbabwe
- Forex
- Crypto












