


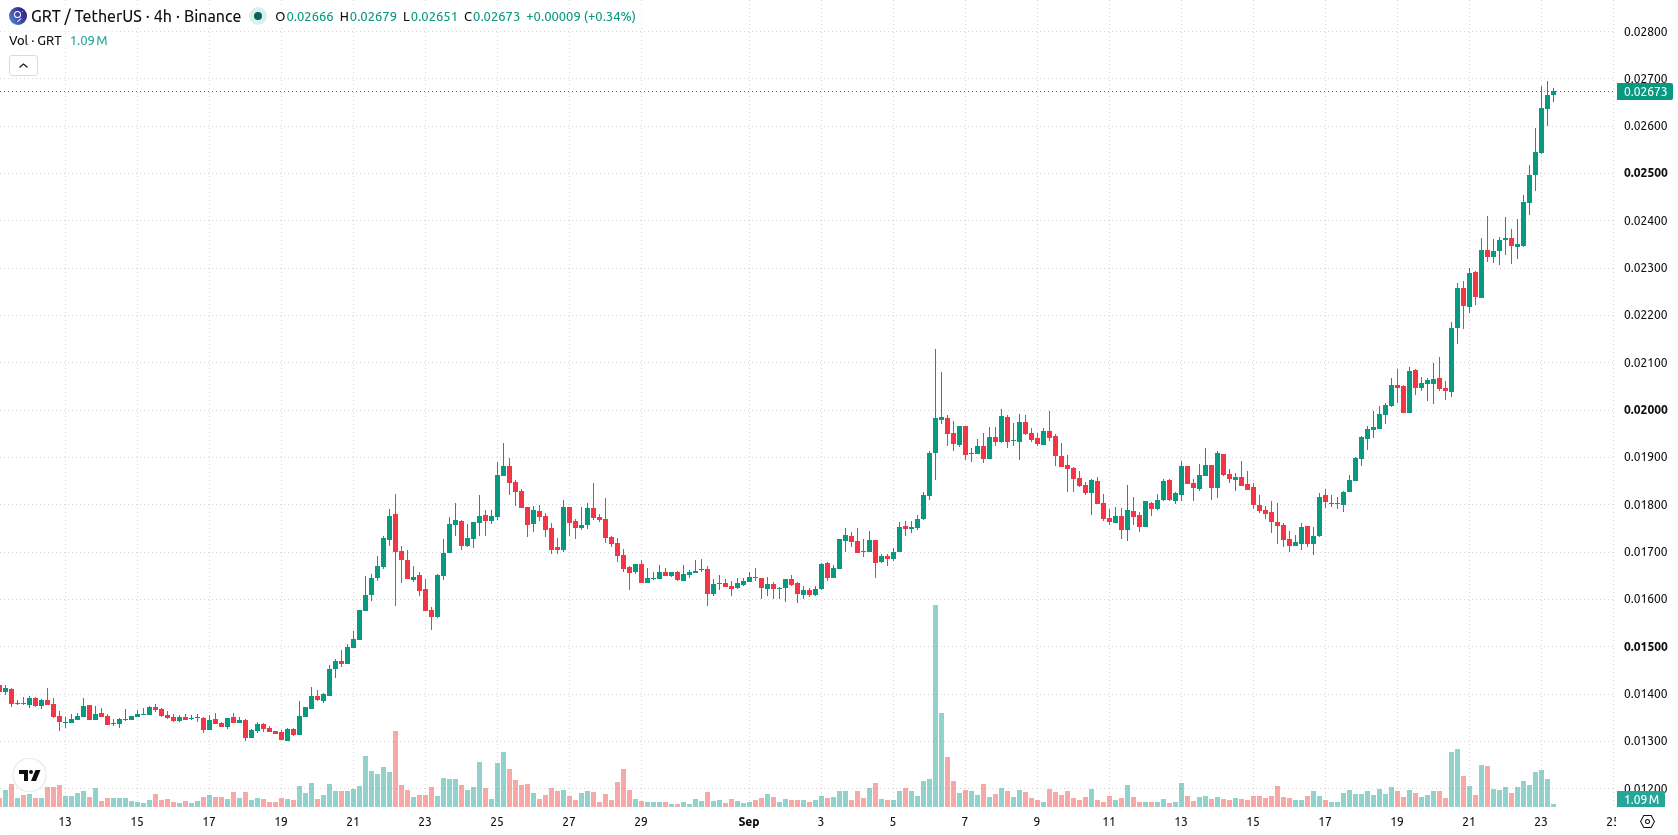
A powerful surge in technical buying pushed The Graph (GRT) higher by 12.54% on strong bullish momentum and sustained upward pressure. This advance is supported by the token's position above its key short-, medium-, and long-term moving averages and multiple overbought readings, signaling a robust uptrend but raising caution around the potential for near-term overheating.
 0.02443
0.02821000
0.02443
0.02821000
Highlights
- GRT/USD is exhibiting bullish momentum across short-, medium-, and long-term timeframes, trading above key moving averages.
- Momentum indicators confirm strong upward pressure, with overbought signals suggesting short-term risk of overheating.
- Price is projected to consolidate between $0.022595 and $0.03283 over the next 5 trading days, with low probability of a downside move.
Bullish momentum persists as price breaks technical resistance and overbought signals emerge
GRT/USD is trading above the 20-day ($0.0193075), 50-day ($0.0168938), and 200-day ($0.02097435) moving averages, signaling established bullish momentum short-, medium-, and long-term. The Ichimoku Kijun at $0.02058 confirms this supportive structure, with the price advancing in clear alignment despite a longer-term bearish bias from the 50-day versus 200-day moving average alignment. Momentum indicators point to sustained strength, as both the Moving Average Convergence Divergence (MACD) and Average Directional Index (ADX) suggest active upward momentum. The Relative Strength Index (RSI), Stochastic RSI, and Commodity Channel Index (CCI) all indicate overbought conditions, signaling potential for shorter-term overheating. Bull/Bear Power (BBP) remains positive, confirming buyer dominance intraday, and the Awesome Oscillator also supports ongoing bullish momentum. GRT/USD is up $0.00297 or 12.54% with an upside gap of approximately $0.00176 (7.43%). The price is near the day’s high inside a $0.02541 - $0.02695 range, with intraday volatility at 6.06%. The tone is strong with upward pressure and little sign of immediate cooling.
Earlier, analysts noted that The Graph was demonstrating strong bullish technical momentum with buyers in firm control. The current breakout not only reinforces this bullish trend but also highlights the importance of monitoring for any early signs of overheating as GRT approaches its upper volatility band.










-
 Afghanistan
-
 Albania
-
 Algeria
-
 Angola
-
 Argentina
-
 Armenia
-
 Australia
-
 Austria
-
 Azerbaijan
-
 Bahamas
-
 Bahrain
-
 Bangladesh
-
 Belarus
-
 Belgium
-
 Bolivia
-
 Botswana
-
 Brazil
-
 Brunei
-
 Bulgaria
-
 Cambodia
-
 Cameroon
-
 Canada
-
 Chile
Chile
-
 China
China
-
 Colombia
-
 Congo
Congo
-
 Costa Rica
-
 Cote d'Ivoire
-
 Croatia
-
 Cuba
Cuba
-
 Cyprus
-
 Czechia
-
 DR Congo
-
 Denmark
-
 Dominican Republic
-
 Ecuador
-
 Egypt
Egypt
-
 El Salvador
-
 Estonia
-
 Eswatini
-
 Ethiopia
-
 Finland
-
 France
-
 Georgia
-
 Germany
-
 Ghana
Ghana
-
 Greece
-
 Haiti
Haiti
-
 Hong Kong
-
 Hungary
-
 India
India
-
 Indonesia
-
 Iran, Islamic republic
-
 Iraq
Iraq
-
 Ireland
-
 Israel
-
 Italy
Italy
-
 Jamaica
-
 Japan
Japan
-
 Jordan
-
 Kazakhstan
-
 Kenya
Kenya
-
 Korea
Korea
-
 Kuwait
-
 Kyrgyzstan
-
 Laos
Laos
-
 Latvia
-
 Lebanon
-
 Lesotho
-
 Libya
Libya
-
 Lithuania
-
 Luxembourg
-
 Madagascar
-
 Malaysia
-
 Malta
Malta
-
 Mauritius
-
 Mexico
-
 Moldova
-
 Mongolia
-
 Montenegro
-
 Morocco
-
 Mozambique
-
 Myanmar
-
 Namibia
-
 Nepal
Nepal
-
 Netherlands
-
 New Zealand
-
 Nigeria
-
 North Macedonia
-
 Norway
-
 Oman
Oman
-
 Pakistan
-
 Palestine
-
 Panama
-
 Papua New Guinea
-
 Paraguay
-
 Peru
Peru
-
 Philippines
-
 Poland
-
 Portugal
-
 Puerto Rico
-
 Qatar
Qatar
-
 Reunion
-
 Romania
-
 Rwanda
-
 Saudi Arabia
-
 Serbia
-
 Singapore
-
 Slovakia
-
 Slovenia
-
 Somalia
-
 South Africa
-
 Spain
Spain
-
 Sri Lanka
-
 Sweden
-
 Switzerland
-
 Syria
Syria
-
 Taiwan
-
 Tajikistan
-
 Tanzania
-
 Thailand
-
 Trinidad and Tobago
-
 Tunisia
-
 Turkey
-
 UAE
UAE
-
 Uganda
-
 Ukraine
-
 United Kingdom
-
United States
-
 Uruguay
-
 Uzbekistan
-
 Venezuela
-
 Vietnam
-
 Yemen
Yemen
-
 Zambia
-
 Zimbabwe
- Forex
- Crypto












