

Will The Graph hold $0.01555 support amid persistent downward price move?

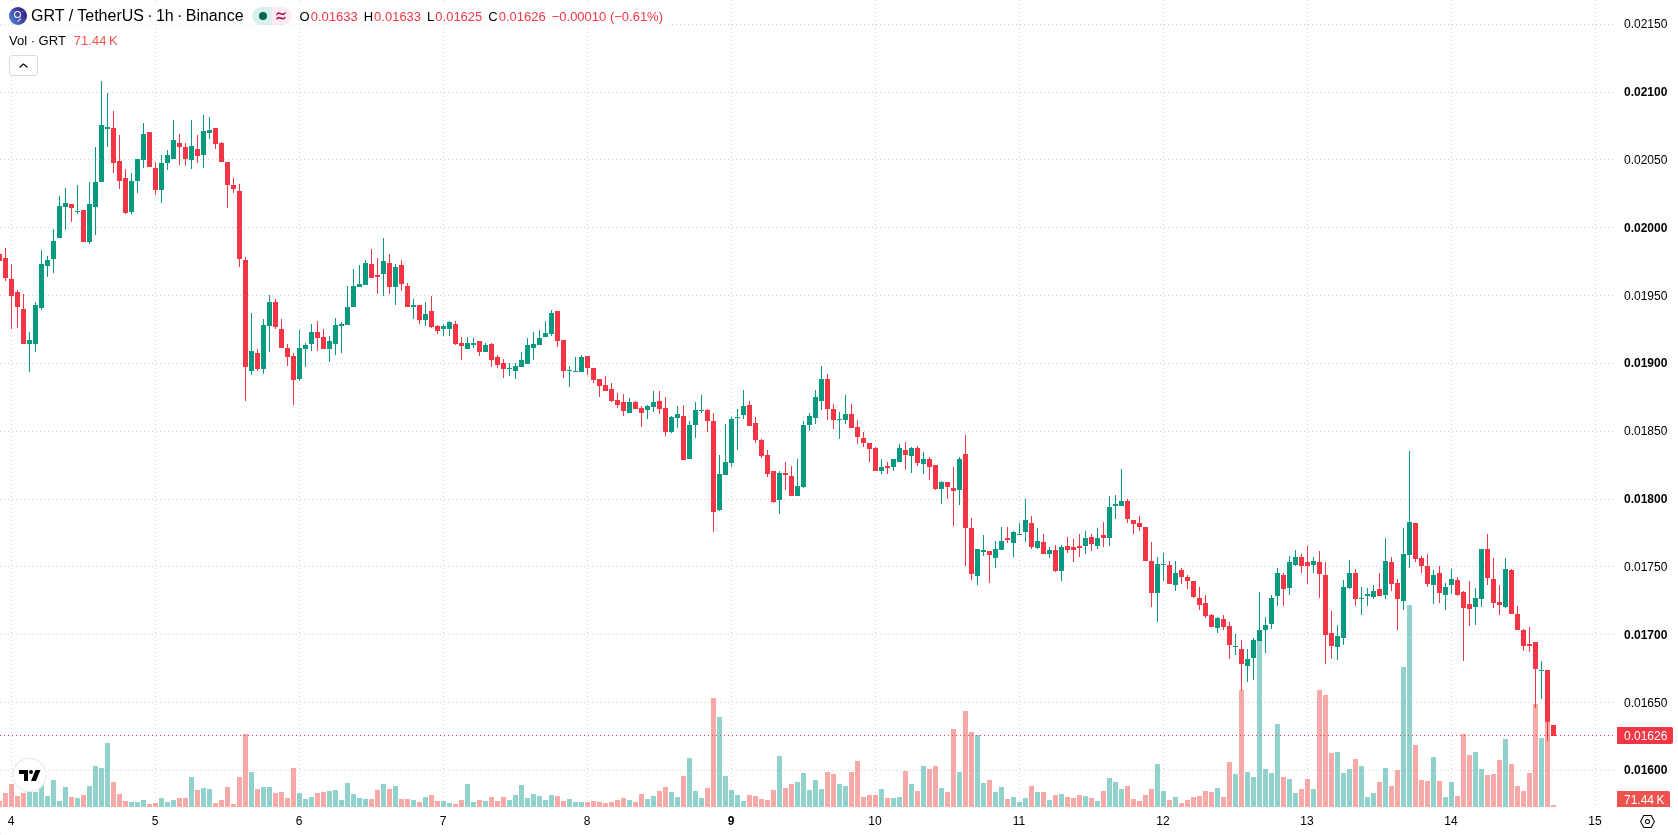
The Graph (GRT) is trading at $0.01634, reflecting a daily decline of 7.26%. The asset is currently positioned below its key moving averages.
 0.01774
0.01905000
Highlights
- GRT/USD trades below major moving averages on multiple timeframes, showing short-term to long-term seller dominance.
- Key technical indicators including MACD and Awesome Oscillator confirm bearish momentum, with intraday seller control and oversold signals emerging.
- Expected price range for the next session is $0.01555 to $0.01689231, with downside risk elevated if price sustains below $0.01555.
Overhead resistance and oversold signals shape momentum outlook
On the technical front, GRT trades below the MA-20 ($0.017215) and MA-50 ($0.0172838) on the 1-hour chart, with the daily MA-200 overhead at $0.02075825. Immediate resistance is highlighted by the Ichimoku Kijun at $0.017405. MACD maintains a sell bias while ADX signals neutral trend strength on the hourly timeframe. Oscillator readings show RSI is neutral, but both Stoch RSI and CCI are in oversold territory, indicating potential but unconfirmed reversal conditions. Bull/Bear Power remains negative, pointing to intraday seller dominance, and Awesome Oscillator confirms continued downside momentum.
Downside favored as volatility band limits rebound odds
For the next trading day, the forecasted range for GRT is $0.01555 to $0.01689231, signaling a typical volatility band relative to current levels. Odds favor further downward pressure, while the chances of an immediate recovery are low. The baseline scenario is for continued consolidation within this band. Should price breakout above the Kijun resistance at $0.017405, a short-term rebound could develop, but a decisive move below $0.01555 would likely trigger further declines.
Earlier, analysts noted that The Graph was under sustained downside pressure with little evidence of an imminent reversal. The present update reinforces this bearish scenario, with continued negative momentum and oversold oscillators suggesting traders should closely watch the $0.01555 level for signs of either breakdown or attempted stabilization.











-
 Afghanistan
-
 Albania
-
 Algeria
-
 Angola
-
 Argentina
-
 Armenia
-
 Australia
-
 Austria
-
 Azerbaijan
-
 Bahamas
-
 Bahrain
-
 Bangladesh
-
 Belarus
-
 Belgium
-
 Bolivia
-
 Botswana
-
 Brazil
-
 Brunei
-
 Bulgaria
-
 Cambodia
-
 Cameroon
-
 Canada
-
 Chile
-
 China
-
 Colombia
-
 Congo
-
 Costa Rica
-
 Cote d'Ivoire
-
 Croatia
-
 Cuba
-
 Cyprus
-
 Czechia
-
 DR Congo
-
 Denmark
-
 Dominican Republic
-
 Ecuador
-
 Egypt
-
 El Salvador
-
 Estonia
-
 Eswatini
-
 Ethiopia
-
 Finland
-
 France
-
 Georgia
-
 Germany
-
 Ghana
-
 Greece
-
 Haiti
-
 Hong Kong
-
 Hungary
-
 India
-
 Indonesia
-
 Iran, Islamic republic
-
 Iraq
-
 Ireland
-
 Israel
-
 Italy
-
 Jamaica
-
 Japan
-
 Jordan
-
 Kazakhstan
-
 Kenya
-
 Korea
-
 Kuwait
-
 Kyrgyzstan
-
 Laos
-
 Latvia
-
 Lebanon
-
 Lesotho
-
 Libya
-
 Lithuania
-
 Luxembourg
-
 Madagascar
-
 Malaysia
-
 Malta
-
 Mauritius
-
 Mexico
-
 Moldova
-
 Mongolia
-
 Montenegro
-
 Morocco
-
 Mozambique
-
 Myanmar
-
 Namibia
-
 Nepal
-
 Netherlands
-
 New Zealand
-
 Nigeria
-
 North Macedonia
-
 Norway
-
 Oman
-
 Pakistan
-
 Palestine
-
 Panama
-
 Papua New Guinea
-
 Paraguay
-
 Peru
-
 Philippines
-
 Poland
-
 Portugal
-
 Puerto Rico
-
 Qatar
-
 Reunion
-
 Romania
-
 Rwanda
-
 Saudi Arabia
-
 Serbia
-
 Singapore
-
 Slovakia
-
 Slovenia
-
 Somalia
-
 South Africa
-
 Spain
-
 Sri Lanka
-
 Sweden
-
 Switzerland
-
 Syria
-
 Taiwan
-
 Tajikistan
-
 Tanzania
-
 Thailand
-
 Trinidad and Tobago
-
 Tunisia
-
 Turkey
-
 UAE
-
 Uganda
-
 Ukraine
-
 United Kingdom
-
United States
-
 Uruguay
-
 Uzbekistan
-
 Venezuela
-
 Vietnam
-
 Yemen
-
 Zambia
-
 Zimbabwe
- Forex
- Crypto












