

GRT weekly forecast: Price action stalls above key $0.01869 support with recovery odds low

The Graph (GRT) is trading around $0.019 after falling nearly 8.5% this week, as it struggles to hold above key support. Corporate infrastructure changes remain the main driver for GRT, setting the stage for continued uncertainty heading into next week.
 0.01905
0.02108000
Highlights
- The Graph trades at $0.01875 after falling 8.46% over the past week to the bottom of its recent range.
- Bearish conditions persist with price below key moving averages, negative trend signals, and oscillators in neutral territory.
- GRT/USD is expected to consolidate between $0.01706 and $0.02001466, with over 80% probability of a further decline unless support at $0.01869 is breached.
Protocol upgrades announced this week set future scaling expectations
The Graph has announced significant infrastructure upgrades that will introduce new scaling requirements effective November 17, 2026, according to Cryptonews.net. These changes, revealed during Graph Office Hours #282, are designed to optimize the protocol's performance and may boost future user engagement and service adoption.
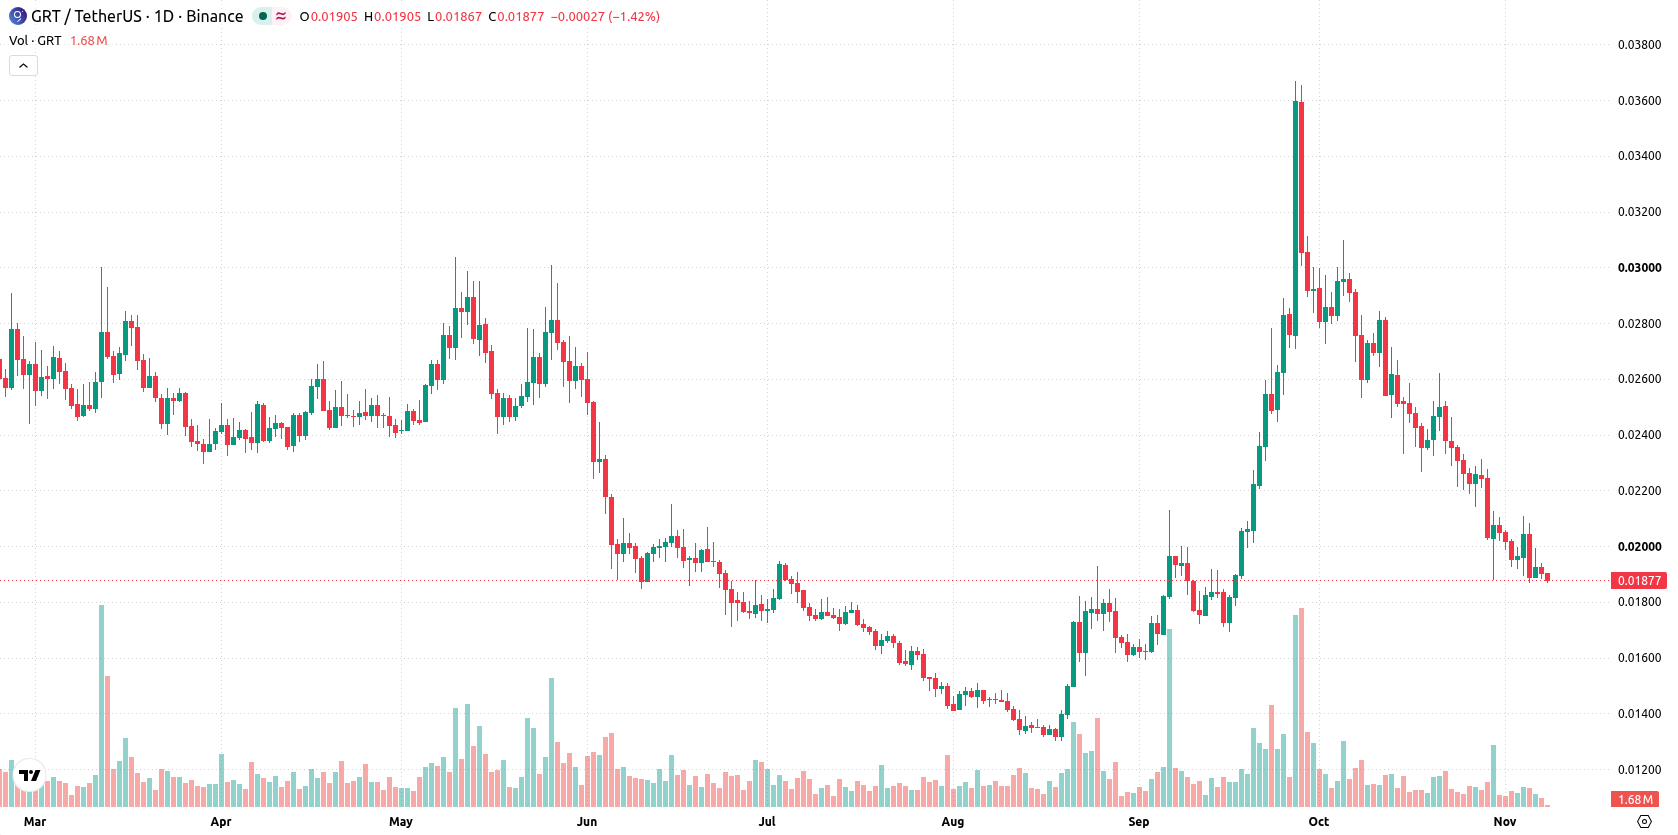
Persistent sell momentum as MACD and ADX confirm bearish pressure
The daily chart reflects a sustained move lower with a firm trend, as evidenced by a consistently negative MACD and ADX, both calling for sell conditions. Oscillator readings, including the RSI at 34.01 and CCI at -98.59, remain neutral. Volatility over the past week stands at 12.79%. The asset is currently pinned against support at $0.01869, while resistance is marked at $0.0209684, with the Ichimoku Kijun ($0.02291) above adding another notable barrier.
Downside risk prevails with low odds of rebound in the coming week
Over the coming week, GRT/USD is expected to trade within a range of $0.01706 to $0.02001466. There is a very low probability (less than 20%) of an increase, while the probability of a further decrease exceeds 80%. The base case sees price respecting support and consolidating just above $0.01869. A decisive breakout above resistance at $0.0209684 could open the door to short-term recovery. Conversely, a daily close below $0.01869 would expose the lower bound at $0.01706.
Earlier, analysts noted that The Graph was experiencing sustained downward momentum despite technical signals of possible exhaustion. The latest price action and new infrastructure upgrade timelines reinforce this cautious outlook, making the $0.01869 support level critical to watch for any shift in direction.











-
 Afghanistan
-
 Albania
-
 Algeria
-
 Angola
-
 Argentina
-
 Armenia
-
 Australia
-
 Austria
-
 Azerbaijan
-
 Bahamas
-
 Bahrain
-
 Bangladesh
-
 Belarus
-
 Belgium
-
 Bolivia
-
 Botswana
-
 Brazil
-
 Brunei
-
 Bulgaria
-
 Cambodia
-
 Cameroon
-
 Canada
-
 Chile
-
 China
-
 Colombia
-
 Congo
-
 Costa Rica
-
 Cote d'Ivoire
-
 Croatia
-
 Cuba
-
 Cyprus
-
 Czechia
-
 DR Congo
-
 Denmark
-
 Dominican Republic
-
 Ecuador
-
 Egypt
-
 El Salvador
-
 Estonia
-
 Eswatini
-
 Ethiopia
-
 Finland
-
 France
-
 Georgia
-
 Germany
-
 Ghana
-
 Greece
-
 Haiti
-
 Hong Kong
-
 Hungary
-
 India
-
 Indonesia
-
 Iran, Islamic republic
-
 Iraq
-
 Ireland
-
 Israel
-
 Italy
-
 Jamaica
-
 Japan
-
 Jordan
-
 Kazakhstan
-
 Kenya
-
 Korea
-
 Kuwait
-
 Kyrgyzstan
-
 Laos
-
 Latvia
-
 Lebanon
-
 Lesotho
-
 Libya
-
 Lithuania
-
 Luxembourg
-
 Madagascar
-
 Malaysia
-
 Malta
-
 Mauritius
-
 Mexico
-
 Moldova
-
 Mongolia
-
 Montenegro
-
 Morocco
-
 Mozambique
-
 Myanmar
-
 Namibia
-
 Nepal
-
 Netherlands
-
 New Zealand
-
 Nigeria
-
 North Macedonia
-
 Norway
-
 Oman
-
 Pakistan
-
 Palestine
-
 Panama
-
 Papua New Guinea
-
 Paraguay
-
 Peru
-
 Philippines
-
 Poland
-
 Portugal
-
 Puerto Rico
-
 Qatar
-
 Reunion
-
 Romania
-
 Rwanda
-
 Saudi Arabia
-
 Serbia
-
 Singapore
-
 Slovakia
-
 Slovenia
-
 Somalia
-
 South Africa
-
 Spain
-
 Sri Lanka
-
 Sweden
-
 Switzerland
-
 Syria
-
 Taiwan
-
 Tajikistan
-
 Tanzania
-
 Thailand
-
 Trinidad and Tobago
-
 Tunisia
-
 Turkey
-
 UAE
-
 Uganda
-
 Ukraine
-
 United Kingdom
-
United States
-
 Uruguay
-
 Uzbekistan
-
 Venezuela
-
 Vietnam
-
 Yemen
-
 Zambia
-
 Zimbabwe
- Forex
- Crypto












