


The Graph (GRT) is trading at $0.01908, posting a decline of 6.88% on the day and closing near session lows. The asset is currently positioned below its key moving averages, reflecting pronounced selling momentum across short- and long-term timeframes.
 0.01905
0.02108000
Highlights
- The Graph introduced major infrastructure upgrades with new scaling requirements that take effect on November 17 to enhance network efficiency.
- Despite these fundamental improvements, user activity and expectations could shift as the protocol launches during ongoing market selling.
- The Graph trades near session lows at $0.01908, with technical indicators showing strong downward momentum and a projected trading range of $0.01772 to $0.01963231 over the next 2 to 3 days.
Network upgrades implemented as fundamentals diverge from market sentiment
The Graph has implemented significant infrastructure upgrades, introducing new scaling requirements that take effect on November 17, according to Cryptonews. These changes are likely aimed at improving network efficiency, which could shift user expectations and modify activity levels on the protocol. However, the rollout has coincided with sustained selling in the broader market, suggesting a disconnect between improving fundamentals and near-term trader sentiment.
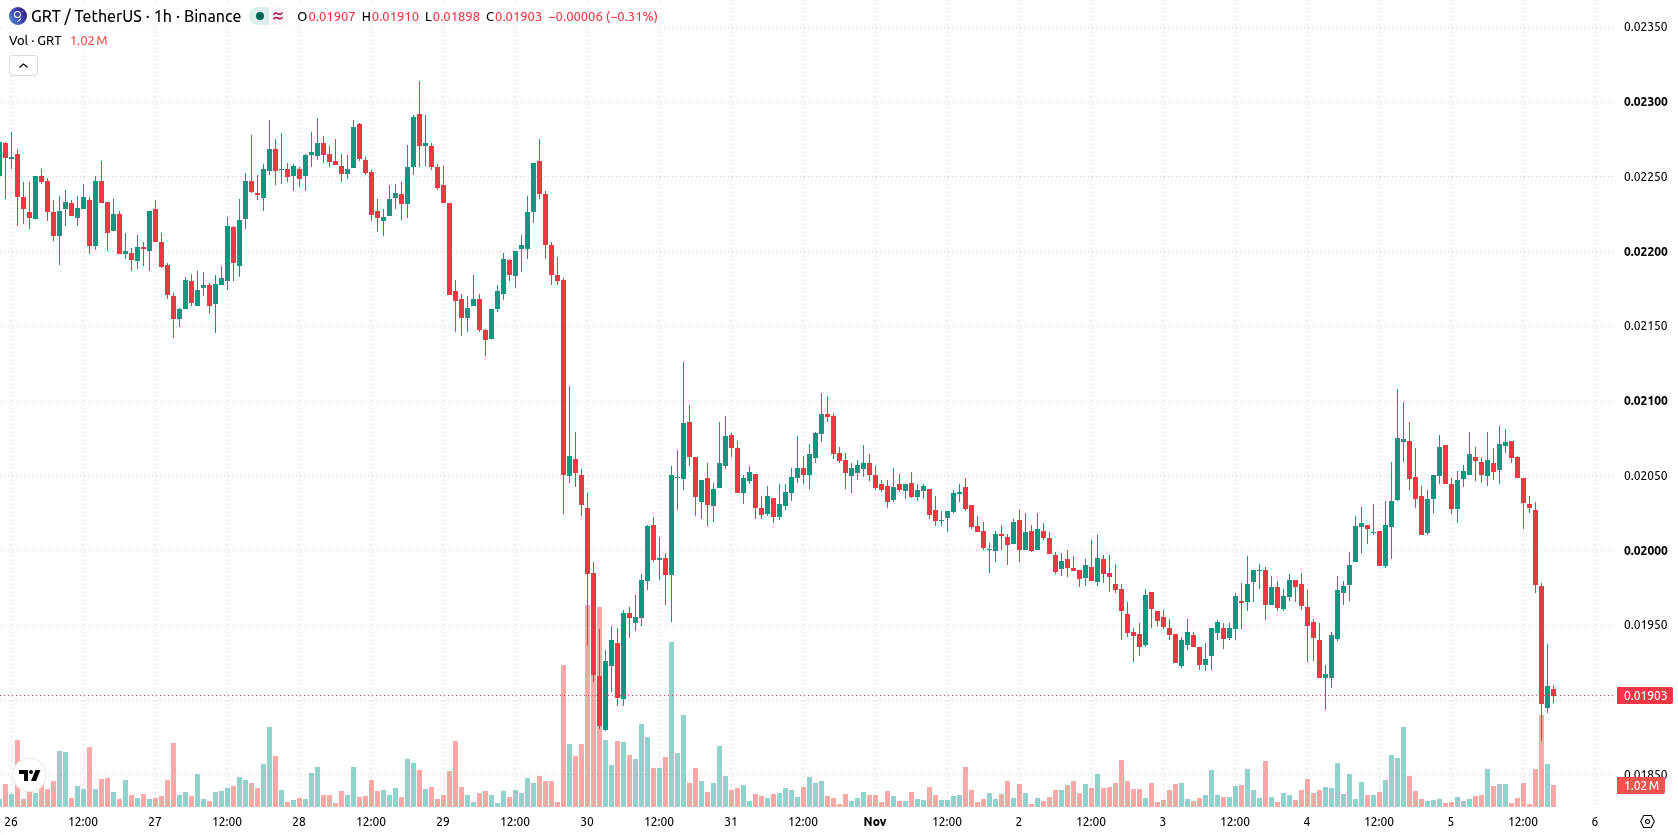
Broad technical weakness as multi-timeframe signals reinforce bearish control
On the technical front, GRT is trading below both the MA-20 and MA-50 on the one-hour chart and remains under the MA-200, confirming pressure across all trend horizons. The nearest resistance is set by the Ichimoku Kijun at $0.0199. Momentum indicators continue to favor the bears: MACD and ADX are flashing sell signals. While RSI is positioned in the neutral range, both Stochastic RSI and CCI display oversold readings, signaling possible selling exhaustion but not yet a confirmed reversal. Bull/Bear Power remains negative, underscoring dominance by sellers.
Sideways pattern projected as downside risk outweighs rebound potential
Over the next two to three trading days, GRT is likely to fluctuate within a volatility band spanning $0.01772 to $0.01963231. The baseline scenario points to sideways price action inside this corridor. Although some oscillators are indicating exhaustion, the probability of a meaningful upward move remains very low, while the risk of further declines is high. Only a decisive breakout above immediate resistance would open the door to a bullish reversal, whereas a break below support could extend the ongoing decline.
Earlier, analysts noted that The Graph was experiencing persistent downward momentum despite oversold technical readings. Current analysis reinforces this view, with ongoing selling pressure suggesting traders should closely monitor for a decisive move above $0.0199 resistance or renewed downside if support near $0.01772 fails.











-
 Afghanistan
-
 Albania
-
 Algeria
-
 Angola
-
 Argentina
-
 Armenia
-
 Australia
-
 Austria
-
 Azerbaijan
-
 Bahamas
-
 Bahrain
-
 Bangladesh
-
 Belarus
-
 Belgium
-
 Bolivia
-
 Botswana
-
 Brazil
-
 Brunei
-
 Bulgaria
-
 Cambodia
-
 Cameroon
-
 Canada
-
 Chile
-
 China
-
 Colombia
-
 Congo
-
 Costa Rica
-
 Cote d'Ivoire
-
 Croatia
-
 Cuba
-
 Cyprus
-
 Czechia
-
 DR Congo
-
 Denmark
-
 Dominican Republic
-
 Ecuador
-
 Egypt
-
 El Salvador
-
 Estonia
-
 Eswatini
-
 Ethiopia
-
 Finland
-
 France
-
 Georgia
-
 Germany
-
 Ghana
-
 Greece
-
 Haiti
-
 Hong Kong
-
 Hungary
-
 India
-
 Indonesia
-
 Iran, Islamic republic
-
 Iraq
-
 Ireland
-
 Israel
-
 Italy
-
 Jamaica
-
 Japan
-
 Jordan
-
 Kazakhstan
-
 Kenya
-
 Korea
-
 Kuwait
-
 Kyrgyzstan
-
 Laos
-
 Latvia
-
 Lebanon
-
 Lesotho
-
 Libya
-
 Lithuania
-
 Luxembourg
-
 Madagascar
-
 Malaysia
-
 Malta
-
 Mauritius
-
 Mexico
-
 Moldova
-
 Mongolia
-
 Montenegro
-
 Morocco
-
 Mozambique
-
 Myanmar
-
 Namibia
-
 Nepal
-
 Netherlands
-
 New Zealand
-
 Nigeria
-
 North Macedonia
-
 Norway
-
 Oman
-
 Pakistan
-
 Palestine
-
 Panama
-
 Papua New Guinea
-
 Paraguay
-
 Peru
-
 Philippines
-
 Poland
-
 Portugal
-
 Puerto Rico
-
 Qatar
-
 Reunion
-
 Romania
-
 Rwanda
-
 Saudi Arabia
-
 Serbia
-
 Singapore
-
 Slovakia
-
 Slovenia
-
 Somalia
-
 South Africa
-
 Spain
-
 Sri Lanka
-
 Sweden
-
 Switzerland
-
 Syria
-
 Taiwan
-
 Tajikistan
-
 Tanzania
-
 Thailand
-
 Trinidad and Tobago
-
 Tunisia
-
 Turkey
-
 UAE
-
 Uganda
-
 Ukraine
-
 United Kingdom
-
United States
-
 Uruguay
-
 Uzbekistan
-
 Venezuela
-
 Vietnam
-
 Yemen
-
 Zambia
-
 Zimbabwe
- Forex
- Crypto












