

The Graph weekly forecast: Oversold indicators raise rebound potential as bears test $0.01879 support

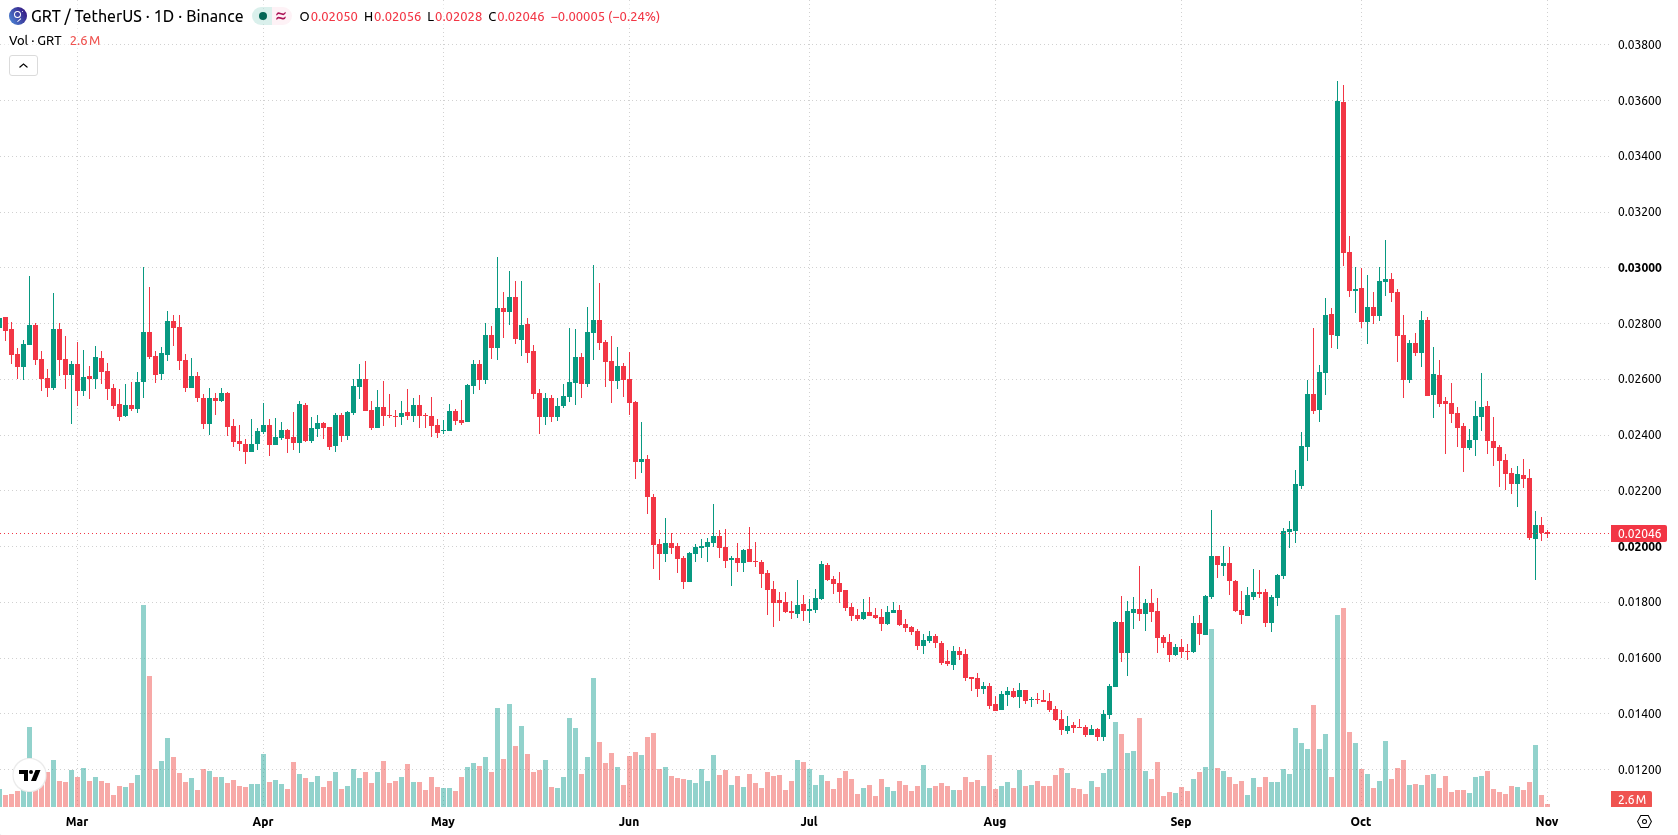
The Graph (GRT) is holding near $0.020 as a sharp decline of nearly 10% over the past week brings focus to whether key support can withstand further pressure. After an extended stretch lower, traders will be watching closely for signs of selling exhaustion or if bearish momentum persists into the coming week.
 0.02056
0.02314000
Highlights
- The Graph fell 9.83% this week to $0.02046, trading well below all major moving averages and indicating persistent technical weakness.
- Momentum indicators such as CCI and Stochastic RSI are in oversold territory, signaling selling pressure may be exhausted but downside risk persists with MACD in sell mode.
- Key levels for the week are support at $0.01879 and resistance at $0.02116035, with an expected range of $0.016368 to $0.0227618 and continued bearish momentum likely.
Oversold signals emerge as bearish momentum dominates this week
On the daily chart, the structure remains heavy after a sharp move lower without a sustained trend, as indicated by the 23.15% volatility over the past week. Both CCI and Stochastic RSI are in their oversold zones, suggesting the possibility of selling exhaustion and potential for a short-term rebound, while the MACD remains in sell territory, keeping downside risk prominent. Immediate support is found at $0.01879, with MA-200 at $0.02116035 acting as the nearest resistance, and the Ichimoku Kijun at $0.024295 providing additional overhead pressure. The mix of oversold momentum signals and persistent bearish trend indicators points to a market seeking confirmation of a bottom.
Downside bias remains as momentum signals flag further weakness
In the week ahead, the expected range is $0.016368 to $0.0227618. There is a very low probability of an increase and a very high probability of a decrease, with momentum signals favoring further downside. Base case expectations call for continued trading between $0.01879 support and $0.02116035 resistance. A decisive move above the MA-200 could trigger a retracement higher toward the Kijun at $0.024295. Conversely, a push below $0.01879 would open risk to the lower boundary of the expected range.
Previously it was reported that The Graph was experiencing sustained bearish momentum amidst persistent technical weakness. The latest analysis reinforces this negative outlook, with traders advised to monitor the $0.01879 support level closely as any sustained breakdown could heighten downside risk in the near term.






Latest GRT News





-
 Afghanistan
-
 Albania
-
 Algeria
-
 Angola
-
 Argentina
-
 Armenia
-
 Australia
-
 Austria
-
 Azerbaijan
-
 Bahamas
-
 Bahrain
-
 Bangladesh
-
 Belarus
-
 Belgium
-
 Bolivia
-
 Botswana
-
 Brazil
-
 Brunei
-
 Bulgaria
-
 Cambodia
-
 Cameroon
-
 Canada
-
 Chile
-
 China
-
 Colombia
-
 Congo
-
 Costa Rica
-
 Cote d'Ivoire
-
 Croatia
-
 Cuba
-
 Cyprus
-
 Czechia
-
 DR Congo
-
 Denmark
-
 Dominican Republic
-
 Ecuador
-
 Egypt
-
 El Salvador
-
 Estonia
-
 Eswatini
-
 Ethiopia
-
 Finland
-
 France
-
 Georgia
-
 Germany
-
 Ghana
-
 Greece
-
 Haiti
-
 Hong Kong
-
 Hungary
-
 India
-
 Indonesia
-
 Iran, Islamic republic
-
 Iraq
-
 Ireland
-
 Israel
-
 Italy
-
 Jamaica
-
 Japan
-
 Jordan
-
 Kazakhstan
-
 Kenya
-
 Korea
-
 Kuwait
-
 Kyrgyzstan
-
 Laos
-
 Latvia
-
 Lebanon
-
 Lesotho
-
 Libya
-
 Lithuania
-
 Luxembourg
-
 Madagascar
-
 Malaysia
-
 Malta
-
 Mauritius
-
 Mexico
-
 Moldova
-
 Mongolia
-
 Montenegro
-
 Morocco
-
 Mozambique
-
 Myanmar
-
 Namibia
-
 Nepal
-
 Netherlands
-
 New Zealand
-
 Nigeria
-
 North Macedonia
-
 Norway
-
 Oman
-
 Pakistan
-
 Palestine
-
 Panama
-
 Papua New Guinea
-
 Paraguay
-
 Peru
-
 Philippines
-
 Poland
-
 Portugal
-
 Puerto Rico
-
 Qatar
-
 Reunion
-
 Romania
-
 Rwanda
-
 Saudi Arabia
-
 Serbia
-
 Singapore
-
 Slovakia
-
 Slovenia
-
 Somalia
-
 South Africa
-
 Spain
-
 Sri Lanka
-
 Sweden
-
 Switzerland
-
 Syria
-
 Taiwan
-
 Tajikistan
-
 Tanzania
-
 Thailand
-
 Trinidad and Tobago
-
 Tunisia
-
 Turkey
-
 UAE
-
 Uganda
-
 Ukraine
-
 United Kingdom
-
United States
-
 Uruguay
-
 Uzbekistan
-
 Venezuela
-
 Vietnam
-
 Yemen
-
 Zambia
-
 Zimbabwe
- Forex
- Crypto












