

The Graph drops almost 11% after persistent bearish technical signals emerge

Persistent bearish technical momentum drove a sharp 10.76% drop in The Graph (GRT) today, as strong selling pressure and negative momentum signals dominated the session. The downtrend is reinforced by prices remaining below major moving averages and oversold signals starting to emerge.
 0.02056
0.02314000
Highlights
- GRT/USD remains below key moving averages with persistent negative momentum across short-, medium-, and long-term trends.
- Momentum indicators and oscillators read strongly bearish or oversold, with sellers dominating intraday action and volatility at 8.46%.
- GRT/USD is projected to trade between $0.01772 and $0.021355 over five days, with over 80% probability of downside or prolonged sideways action.
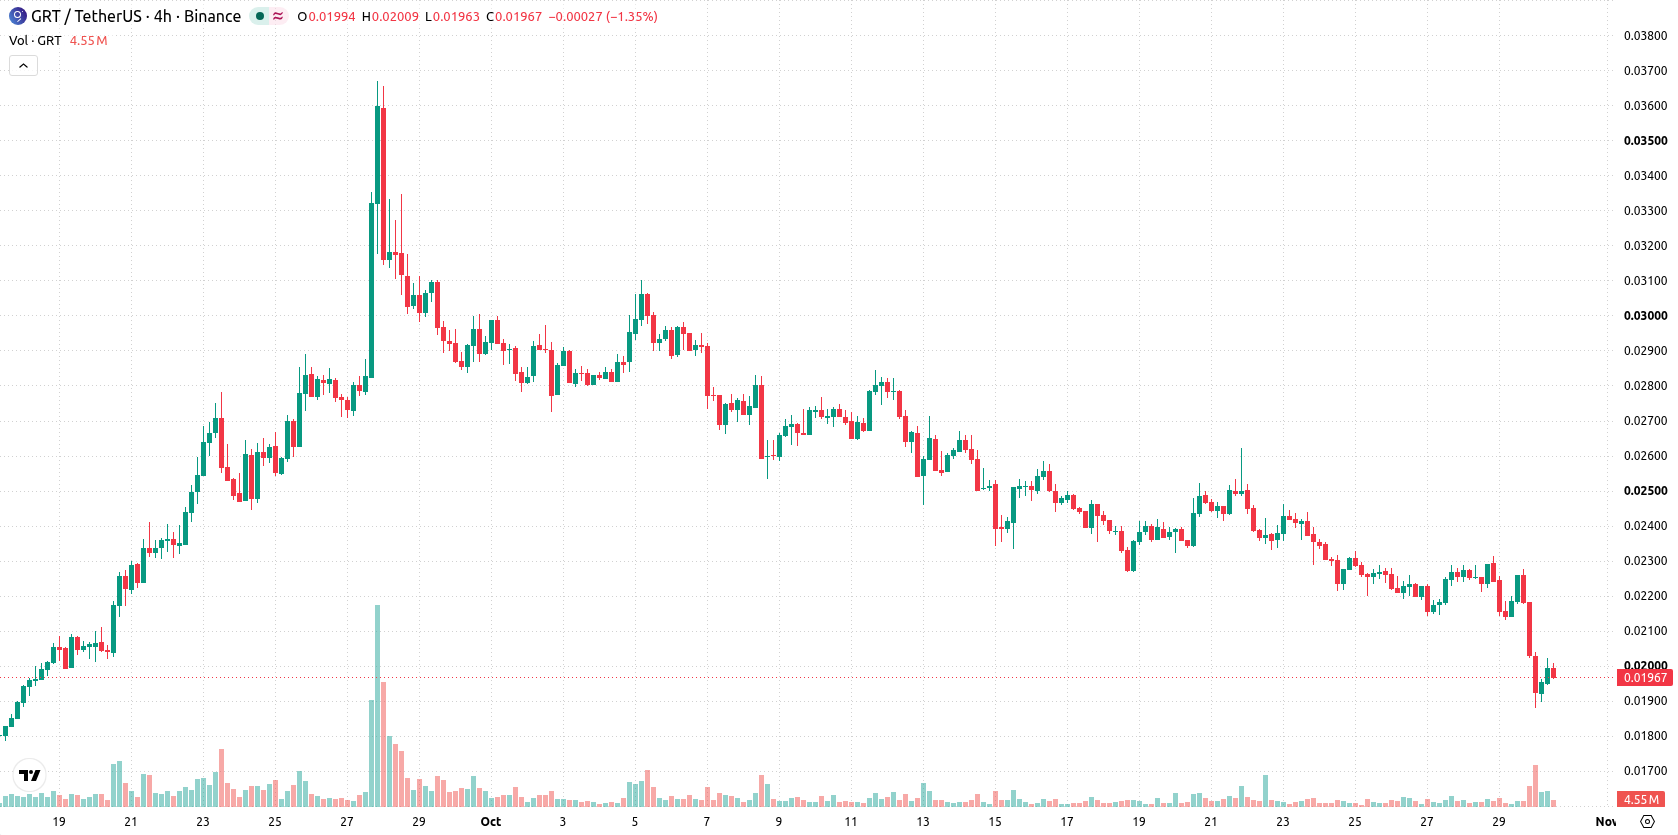
Downward bias persists as bearish indicators override medium-term structure
GRT/USD remains pressured below its 20-day ($0.02426), 50-day ($0.0245654), and 200-day ($0.02120465) moving averages, signaling negative momentum across short-, medium-, and long-term trends. The nearest resistance is at $0.02023, with support located at $0.01879. The medium-term structure is still bullish due to the MA-50 vs MA-200 alignment. Momentum indicators highlight strong bearish pressure: MACD and Average Directional Index (ADX) both signal a sell. The Relative Strength Index (RSI) stands at 37, nearing oversold, while the Commodity Channel Index (CCI) and Stochastic RSI both confirm oversold conditions. Bull/Bear Power (BBP) is negative, indicating sellers dominate intraday action, and the Awesome Oscillator also supports the bearish trend. The price has fallen to $0.01966, down 10.76% today after a downside gap of roughly 7.94%. Price is currently mid-range, intraday volatility stands at 8.46%. The intraday tone is weak, with persistent selling pressure since the open, matching the momentum signals.
Previously it was reported that The Graph (GRT) was facing ongoing bearish momentum, with technical indicators suggesting sustained downside risk. The current analysis reinforces this negative outlook, emphasizing that traders should closely watch for a potential downside break below $0.01772 as the next key risk event.











-
 Afghanistan
-
 Albania
-
 Algeria
-
 Angola
-
 Argentina
-
 Armenia
-
 Australia
-
 Austria
-
 Azerbaijan
-
 Bahamas
-
 Bahrain
-
 Bangladesh
-
 Belarus
-
 Belgium
-
 Bolivia
-
 Botswana
-
 Brazil
-
 Brunei
-
 Bulgaria
-
 Cambodia
-
 Cameroon
-
 Canada
-
 Chile
-
 China
-
 Colombia
-
 Congo
-
 Costa Rica
-
 Cote d'Ivoire
-
 Croatia
-
 Cuba
-
 Cyprus
-
 Czechia
-
 DR Congo
-
 Denmark
-
 Dominican Republic
-
 Ecuador
-
 Egypt
-
 El Salvador
-
 Estonia
-
 Eswatini
-
 Ethiopia
-
 Finland
-
 France
-
 Georgia
-
 Germany
-
 Ghana
-
 Greece
-
 Haiti
-
 Hong Kong
-
 Hungary
-
 India
-
 Indonesia
-
 Iran, Islamic republic
-
 Iraq
-
 Ireland
-
 Israel
-
 Italy
-
 Jamaica
-
 Japan
-
 Jordan
-
 Kazakhstan
-
 Kenya
-
 Korea
-
 Kuwait
-
 Kyrgyzstan
-
 Laos
-
 Latvia
-
 Lebanon
-
 Lesotho
-
 Libya
-
 Lithuania
-
 Luxembourg
-
 Madagascar
-
 Malaysia
-
 Malta
-
 Mauritius
-
 Mexico
-
 Moldova
-
 Mongolia
-
 Montenegro
-
 Morocco
-
 Mozambique
-
 Myanmar
-
 Namibia
-
 Nepal
-
 Netherlands
-
 New Zealand
-
 Nigeria
-
 North Macedonia
-
 Norway
-
 Oman
-
 Pakistan
-
 Palestine
-
 Panama
-
 Papua New Guinea
-
 Paraguay
-
 Peru
-
 Philippines
-
 Poland
-
 Portugal
-
 Puerto Rico
-
 Qatar
-
 Reunion
-
 Romania
-
 Rwanda
-
 Saudi Arabia
-
 Serbia
-
 Singapore
-
 Slovakia
-
 Slovenia
-
 Somalia
-
 South Africa
-
 Spain
-
 Sri Lanka
-
 Sweden
-
 Switzerland
-
 Syria
-
 Taiwan
-
 Tajikistan
-
 Tanzania
-
 Thailand
-
 Trinidad and Tobago
-
 Tunisia
-
 Turkey
-
 UAE
-
 Uganda
-
 Ukraine
-
 United Kingdom
-
United States
-
 Uruguay
-
 Uzbekistan
-
 Venezuela
-
 Vietnam
-
 Yemen
-
 Zambia
-
 Zimbabwe
- Forex
- Crypto












