

The Graph falls amid seller pressure and oversold trading signals

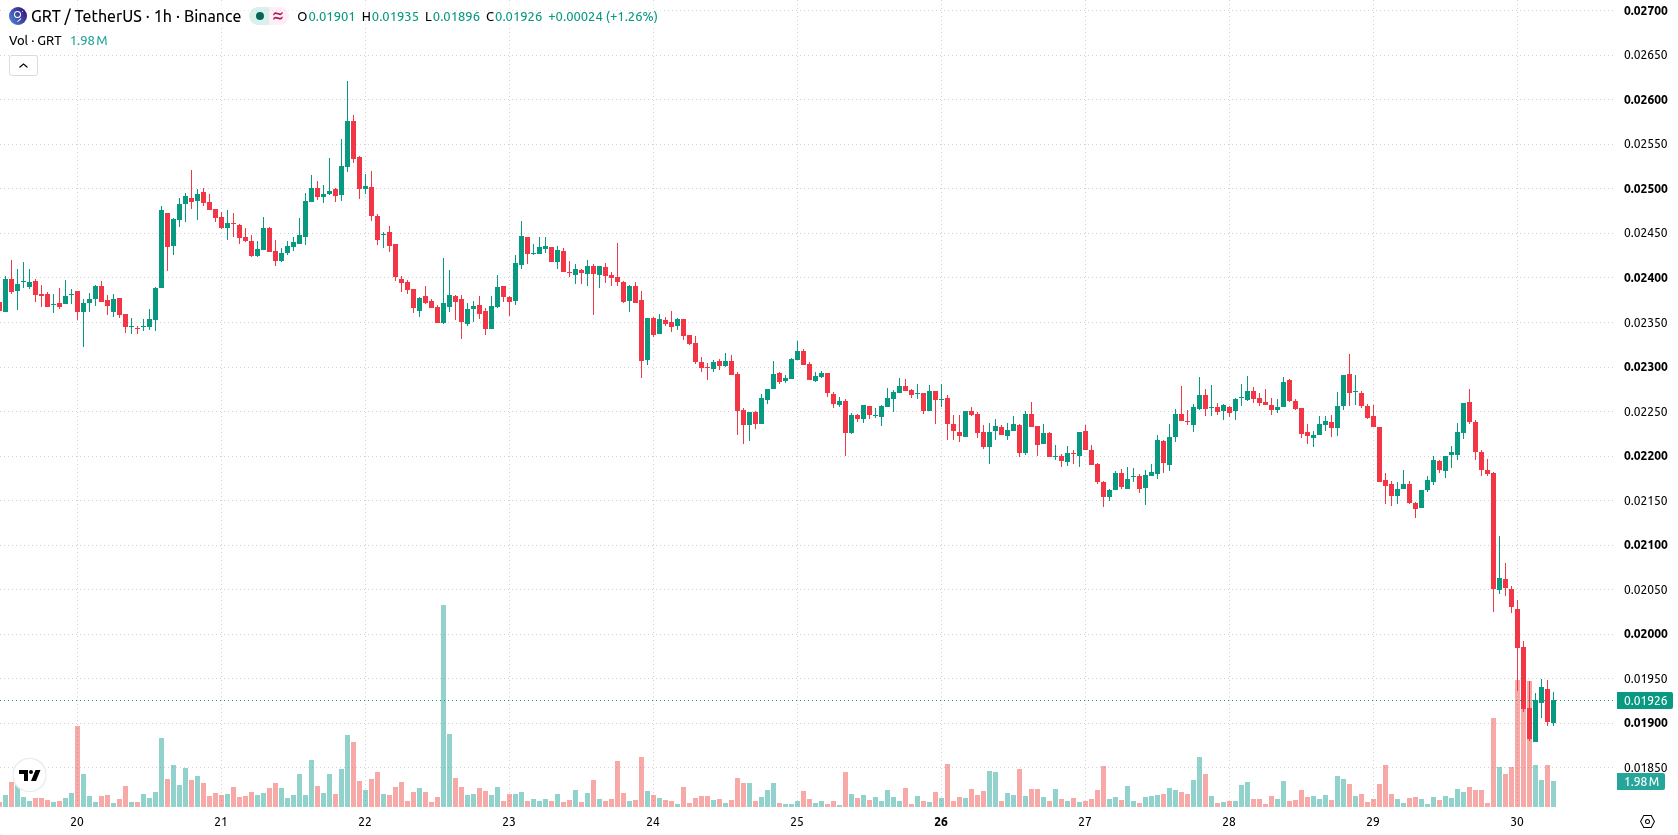
The Graph (GRT) is trading at $0.01915 after a steep daily drop of 11.22%. The asset currently sits below its key moving averages, reflecting ongoing downside momentum relative to recent price trends.
 0.02027
0.02314000
Highlights
- GRT/USD trades below short-, medium-, and long-term moving averages, confirming persistent selling pressure across all timeframes.
- Momentum indicators such as ADX, MACD, and CCI confirm a sell bias, with oversold readings and strong seller dominance.
- Price fell 11.22% today and is expected to remain in a $0.0182 to $0.01990803 range, with a high probability of continued downside.
Oversold signals and bearish momentum as technical barriers persist
On the technical front, GRT/USD is trading below its MA-20 ($0.02094) and MA-50 ($0.02172) on the h1 timeframe, as well as under the daily MA-200 ($0.02120). The daily Ichimoku Kijun at $0.02077 marks the nearest resistance level. RSI stands at 30.45 and CCI is negative, both signaling oversold conditions, while MACD and ADX confirm a sell bias. Bull/Bear Power indicates sustained seller control, Stochastic RSI is neutral, and the Awesome Oscillator does not currently support the prevailing bearish momentum.
Further declines likely as downside risk outweighs rebound hopes
Over the next 2–3 trading days, GRT/USD is projected to trade within the $0.0182 to $0.01990803 range. The odds of a further downward move remain much higher than those of a rebound, suggesting a continued decline is likely. If the price breaks above the immediate resistance at $0.02077, a short-term bullish scenario may develop, while a move below $0.0182 would confirm additional downside risk.
Earlier, analysts noted that The Graph was experiencing ongoing bearish momentum with technical indicators pointing to sustained downside pressure. The current analysis supports this negative outlook, highlighting that traders should closely monitor potential volatility around the $0.0182 support, where a decisive break could indicate additional downside risk.









-
 Afghanistan
-
 Albania
-
 Algeria
-
 Angola
-
 Argentina
-
 Armenia
-
 Australia
-
 Austria
-
 Azerbaijan
-
 Bahamas
-
 Bahrain
-
 Bangladesh
-
 Belarus
-
 Belgium
-
 Bolivia
-
 Botswana
-
 Brazil
-
 Brunei
-
 Bulgaria
-
 Cambodia
-
 Cameroon
-
 Canada
-
 Chile
-
 China
-
 Colombia
-
 Congo
-
 Costa Rica
-
 Cote d'Ivoire
-
 Croatia
-
 Cuba
-
 Cyprus
-
 Czechia
-
 DR Congo
-
 Denmark
-
 Dominican Republic
-
 Ecuador
-
 Egypt
-
 El Salvador
-
 Estonia
-
 Eswatini
-
 Ethiopia
-
 Finland
-
 France
-
 Georgia
-
 Germany
-
 Ghana
-
 Greece
-
 Haiti
-
 Hong Kong
-
 Hungary
-
 India
-
 Indonesia
-
 Iran, Islamic republic
-
 Iraq
-
 Ireland
-
 Israel
-
 Italy
-
 Jamaica
-
 Japan
-
 Jordan
-
 Kazakhstan
-
 Kenya
-
 Korea
-
 Kuwait
-
 Kyrgyzstan
-
 Laos
-
 Latvia
-
 Lebanon
-
 Lesotho
-
 Libya
-
 Lithuania
-
 Luxembourg
-
 Madagascar
-
 Malaysia
-
 Malta
-
 Mauritius
-
 Mexico
-
 Moldova
-
 Mongolia
-
 Montenegro
-
 Morocco
-
 Mozambique
-
 Myanmar
-
 Namibia
-
 Nepal
-
 Netherlands
-
 New Zealand
-
 Nigeria
-
 North Macedonia
-
 Norway
-
 Oman
-
 Pakistan
-
 Palestine
-
 Panama
-
 Papua New Guinea
-
 Paraguay
-
 Peru
-
 Philippines
-
 Poland
-
 Portugal
-
 Puerto Rico
-
 Qatar
-
 Reunion
-
 Romania
-
 Rwanda
-
 Saudi Arabia
-
 Serbia
-
 Singapore
-
 Slovakia
-
 Slovenia
-
 Somalia
-
 South Africa
-
 Spain
-
 Sri Lanka
-
 Sweden
-
 Switzerland
-
 Syria
-
 Taiwan
-
 Tajikistan
-
 Tanzania
-
 Thailand
-
 Trinidad and Tobago
-
 Tunisia
-
 Turkey
-
 UAE
-
 Uganda
-
 Ukraine
-
 United Kingdom
-
United States
-
 Uruguay
-
 Uzbekistan
-
 Venezuela
-
 Vietnam
-
 Yemen
-
 Zambia
-
 Zimbabwe
- Forex
- Crypto












