

Will The Graph avoid a deeper drop amid strong downward price move?

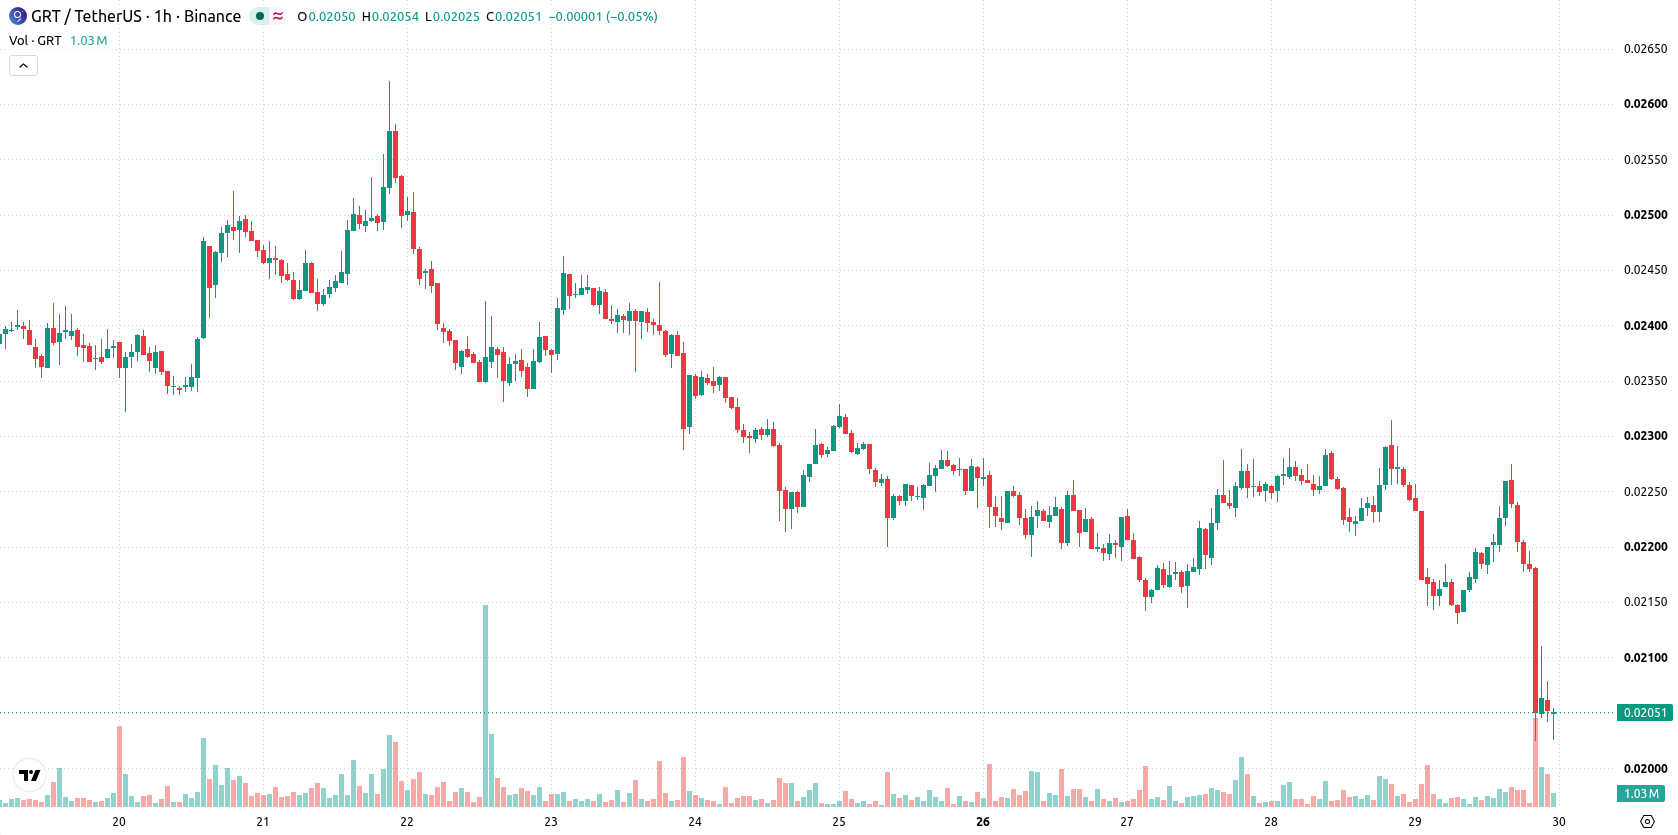
The Graph (GRT) is trading at $0.02047, down 9.26% over the last 24 hours. The asset is currently positioned below its key moving averages, indicating consistent selling pressure in the current session.
 0.02027
0.02314000
Highlights
- GRT/USD trades below all major moving averages, with continued downward pressure across short, medium, and long-term timeframes.
- Momentum and oscillator indicators signal strong seller control, showing oversold conditions and confirming an ongoing bearish trend.
- GRT/USD is projected to consolidate between $0.01975222 and $0.02118778 over the next three days, with a very high down probability and low likelihood of reversal.
Downside momentum intensifies amid oversold technical signals
GRT/USD is trading below the MA-20 and MA-50 on the hourly chart, and also beneath the MA-200 on the daily timeframe. The immediate resistance is located at the Ichimoku Kijun line at $0.021575. Momentum indicators show strong downside signals: MACD and ADX have both generated Sell signals, while RSI stands at 30.83, placing it squarely in oversold territory. Stoch RSI and CCI also indicate oversold conditions, and negative Bull/Bear Power reflects clear intraday seller dominance. The Awesome Oscillator is aligned with the downward direction. The price opened with a small downward gap of $0.00012 and closed near the daily low, amid high volatility, confirming that sellers remain in control.
Consolidation likely as downside breakout risks remain elevated
Over the next 2 to 3 trading days, GRT/USD is expected to consolidate within the $0.01975222 to $0.02118778 range, with a very low probability of an upward move and a high probability of further downside. The baseline scenario is a period of consolidation inside this corridor. If the price closes above the immediate resistance at $0.021575, a recovery may develop. Conversely, a break below $0.01975222 would likely accelerate the ongoing decline.
Earlier, analysts noted that The Graph was exhibiting sustained bearish momentum, with technical indicators pointing to ongoing downside pressure. The current analysis reaffirms this negative bias, highlighting that traders should closely monitor the $0.01975222 support, as a break below this level could trigger accelerated losses in the near term.











-
 Afghanistan
-
 Albania
-
 Algeria
-
 Angola
-
 Argentina
-
 Armenia
-
 Australia
-
 Austria
-
 Azerbaijan
-
 Bahamas
-
 Bahrain
-
 Bangladesh
-
 Belarus
-
 Belgium
-
 Bolivia
-
 Botswana
-
 Brazil
-
 Brunei
-
 Bulgaria
-
 Cambodia
-
 Cameroon
-
 Canada
-
 Chile
-
 China
-
 Colombia
-
 Congo
-
 Costa Rica
-
 Cote d'Ivoire
-
 Croatia
-
 Cuba
-
 Cyprus
-
 Czechia
-
 DR Congo
-
 Denmark
-
 Dominican Republic
-
 Ecuador
-
 Egypt
-
 El Salvador
-
 Estonia
-
 Eswatini
-
 Ethiopia
-
 Finland
-
 France
-
 Georgia
-
 Germany
-
 Ghana
-
 Greece
-
 Haiti
-
 Hong Kong
-
 Hungary
-
 India
-
 Indonesia
-
 Iran, Islamic republic
-
 Iraq
-
 Ireland
-
 Israel
-
 Italy
-
 Jamaica
-
 Japan
-
 Jordan
-
 Kazakhstan
-
 Kenya
-
 Korea
-
 Kuwait
-
 Kyrgyzstan
-
 Laos
-
 Latvia
-
 Lebanon
-
 Lesotho
-
 Libya
-
 Lithuania
-
 Luxembourg
-
 Madagascar
-
 Malaysia
-
 Malta
-
 Mauritius
-
 Mexico
-
 Moldova
-
 Mongolia
-
 Montenegro
-
 Morocco
-
 Mozambique
-
 Myanmar
-
 Namibia
-
 Nepal
-
 Netherlands
-
 New Zealand
-
 Nigeria
-
 North Macedonia
-
 Norway
-
 Oman
-
 Pakistan
-
 Palestine
-
 Panama
-
 Papua New Guinea
-
 Paraguay
-
 Peru
-
 Philippines
-
 Poland
-
 Portugal
-
 Puerto Rico
-
 Qatar
-
 Reunion
-
 Romania
-
 Rwanda
-
 Saudi Arabia
-
 Serbia
-
 Singapore
-
 Slovakia
-
 Slovenia
-
 Somalia
-
 South Africa
-
 Spain
-
 Sri Lanka
-
 Sweden
-
 Switzerland
-
 Syria
-
 Taiwan
-
 Tajikistan
-
 Tanzania
-
 Thailand
-
 Trinidad and Tobago
-
 Tunisia
-
 Turkey
-
 UAE
-
 Uganda
-
 Ukraine
-
 United Kingdom
-
United States
-
 Uruguay
-
 Uzbekistan
-
 Venezuela
-
 Vietnam
-
 Yemen
-
 Zambia
-
 Zimbabwe
- Forex
- Crypto












