

The Graph consolidation likely as resistance at MA-50 limits rebound potential: weekly analysis

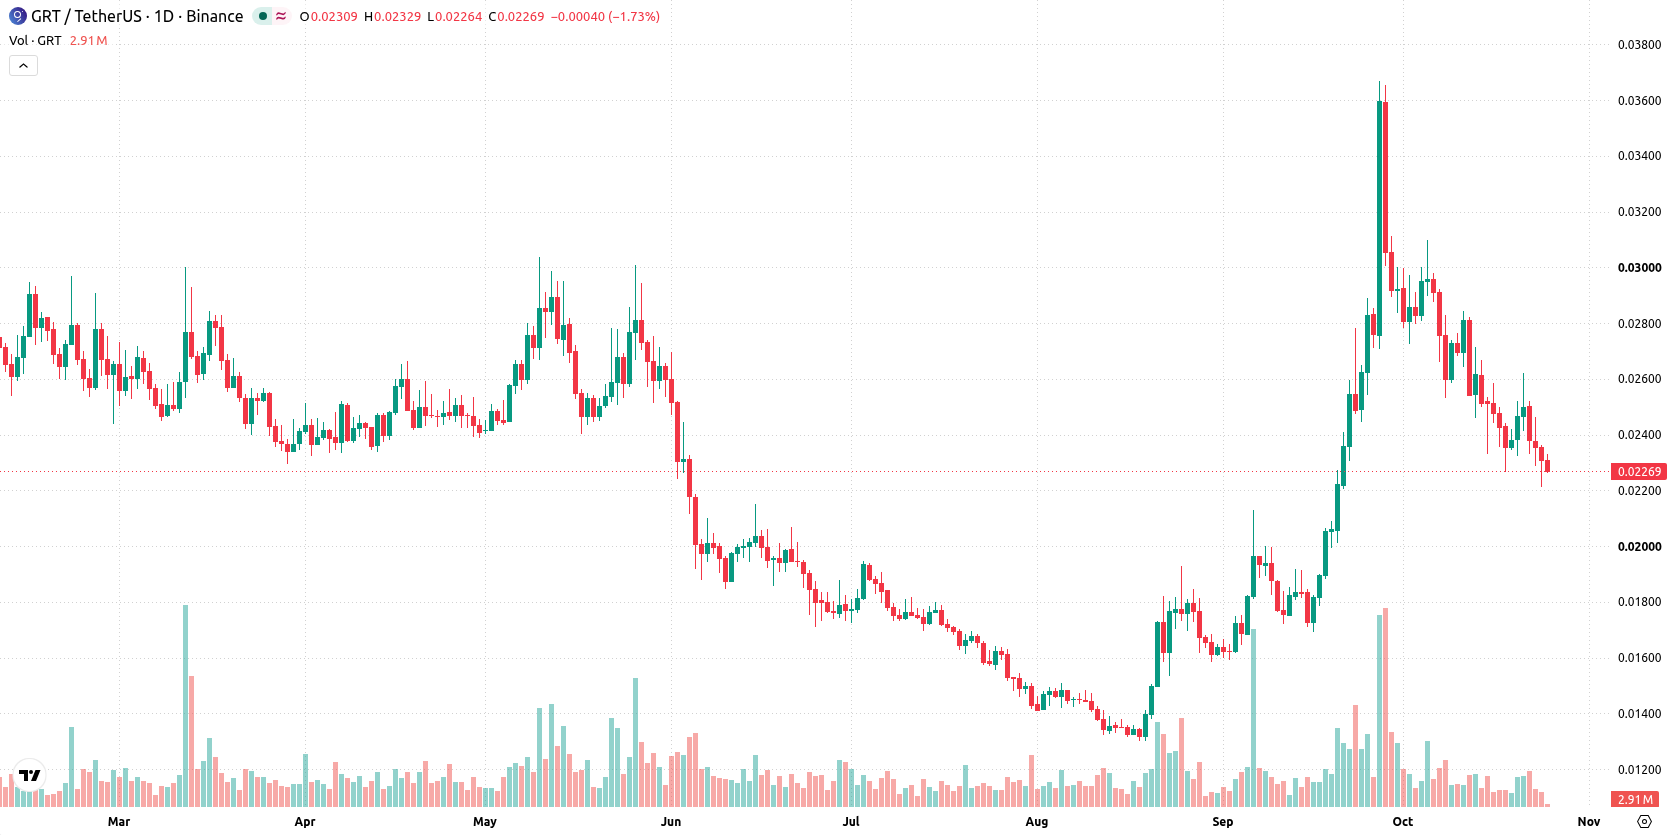
The Graph (GRT) remains under pressure near $0.023 after a decline of nearly 5% over the past week. Technical weakness has deepened, with persistent selling driving the asset toward a key support area. The upcoming week will hinge on whether this support zone attracts any buyers or if more downside is in store.
 0.02038
0.02362000
Highlights
- The Graph trades at $0.0227 after dropping 4.91% over the past week and sits below key short-term moving averages.
- Technical indicators show daily momentum remains bearish with volatility at 18.44% and short-term downside pressure.
- The Graph is expected to consolidate between $0.02213 support and $0.0242292 resistance with a 74% probability of further decline within a $0.02054106 to $0.02724 range.
Momentum signals deepen bearish bias as volatility accelerates this week
Daily momentum signals present a bearish setup, with MACD and HMA both forecasting lower prices and Stochastic RSI in the oversold zone at 0. Volatility over the past seven days reached 18.44%, reinforcing the sharp move lower without a sustained trend. Key support rests at $0.02213, while resistance aligns with the MA-50 at $0.0242292 and the Ichimoku Kijun at $0.02663. The setup suggests sellers remain in control unless a decisive move through resistance emerges.
Downside risk dominates next week with consolidation bias unless breakout
Over the coming week, The Graph is expected to trade within a range of $0.02054106 to $0.02724. There is a 26% probability of an increase and a 74% probability of a decrease. The base case sees extended consolidation between $0.02213 support and $0.0242292 resistance. Should price clear $0.0242292, a move toward $0.02663 becomes possible. If the $0.02213 support gives way, downside risk intensifies toward $0.02054106.
Earlier, analysts noted that The Graph was exhibiting persistent bearish momentum, with technical indicators pointing toward ongoing downside pressure. The current analysis reinforces this outlook, highlighting that traders should closely monitor the $0.02213 support zone as a potential inflection point in the week ahead.






Latest GRT News





-
 Afghanistan
-
 Albania
-
 Algeria
-
 Angola
-
 Argentina
-
 Armenia
-
 Australia
-
 Austria
-
 Azerbaijan
-
 Bahamas
-
 Bahrain
-
 Bangladesh
-
 Belarus
-
 Belgium
-
 Bolivia
-
 Botswana
-
 Brazil
-
 Brunei
-
 Bulgaria
-
 Cambodia
-
 Cameroon
-
 Canada
-
 Chile
-
 China
-
 Colombia
-
 Congo
-
 Costa Rica
-
 Cote d'Ivoire
-
 Croatia
-
 Cuba
-
 Cyprus
-
 Czechia
-
 DR Congo
-
 Denmark
-
 Dominican Republic
-
 Ecuador
-
 Egypt
-
 El Salvador
-
 Estonia
-
 Eswatini
-
 Ethiopia
-
 Finland
-
 France
-
 Georgia
-
 Germany
-
 Ghana
-
 Greece
-
 Haiti
-
 Hong Kong
-
 Hungary
-
 India
-
 Indonesia
-
 Iran, Islamic republic
-
 Iraq
-
 Ireland
-
 Israel
-
 Italy
-
 Jamaica
-
 Japan
-
 Jordan
-
 Kazakhstan
-
 Kenya
-
 Korea
-
 Kuwait
-
 Kyrgyzstan
-
 Laos
-
 Latvia
-
 Lebanon
-
 Lesotho
-
 Libya
-
 Lithuania
-
 Luxembourg
-
 Madagascar
-
 Malaysia
-
 Malta
-
 Mauritius
-
 Mexico
-
 Moldova
-
 Mongolia
-
 Montenegro
-
 Morocco
-
 Mozambique
-
 Myanmar
-
 Namibia
-
 Nepal
-
 Netherlands
-
 New Zealand
-
 Nigeria
-
 North Macedonia
-
 Norway
-
 Oman
-
 Pakistan
-
 Palestine
-
 Panama
-
 Papua New Guinea
-
 Paraguay
-
 Peru
-
 Philippines
-
 Poland
-
 Portugal
-
 Puerto Rico
-
 Qatar
-
 Reunion
-
 Romania
-
 Rwanda
-
 Saudi Arabia
-
 Serbia
-
 Singapore
-
 Slovakia
-
 Slovenia
-
 Somalia
-
 South Africa
-
 Spain
-
 Sri Lanka
-
 Sweden
-
 Switzerland
-
 Syria
-
 Taiwan
-
 Tajikistan
-
 Tanzania
-
 Thailand
-
 Trinidad and Tobago
-
 Tunisia
-
 Turkey
-
 UAE
-
 Uganda
-
 Ukraine
-
 United Kingdom
-
United States
-
 Uruguay
-
 Uzbekistan
-
 Venezuela
-
 Vietnam
-
 Yemen
-
 Zambia
-
 Zimbabwe
- Forex
- Crypto












