

The Graph price outlook: Bearish momentum dominates as sellers retain control

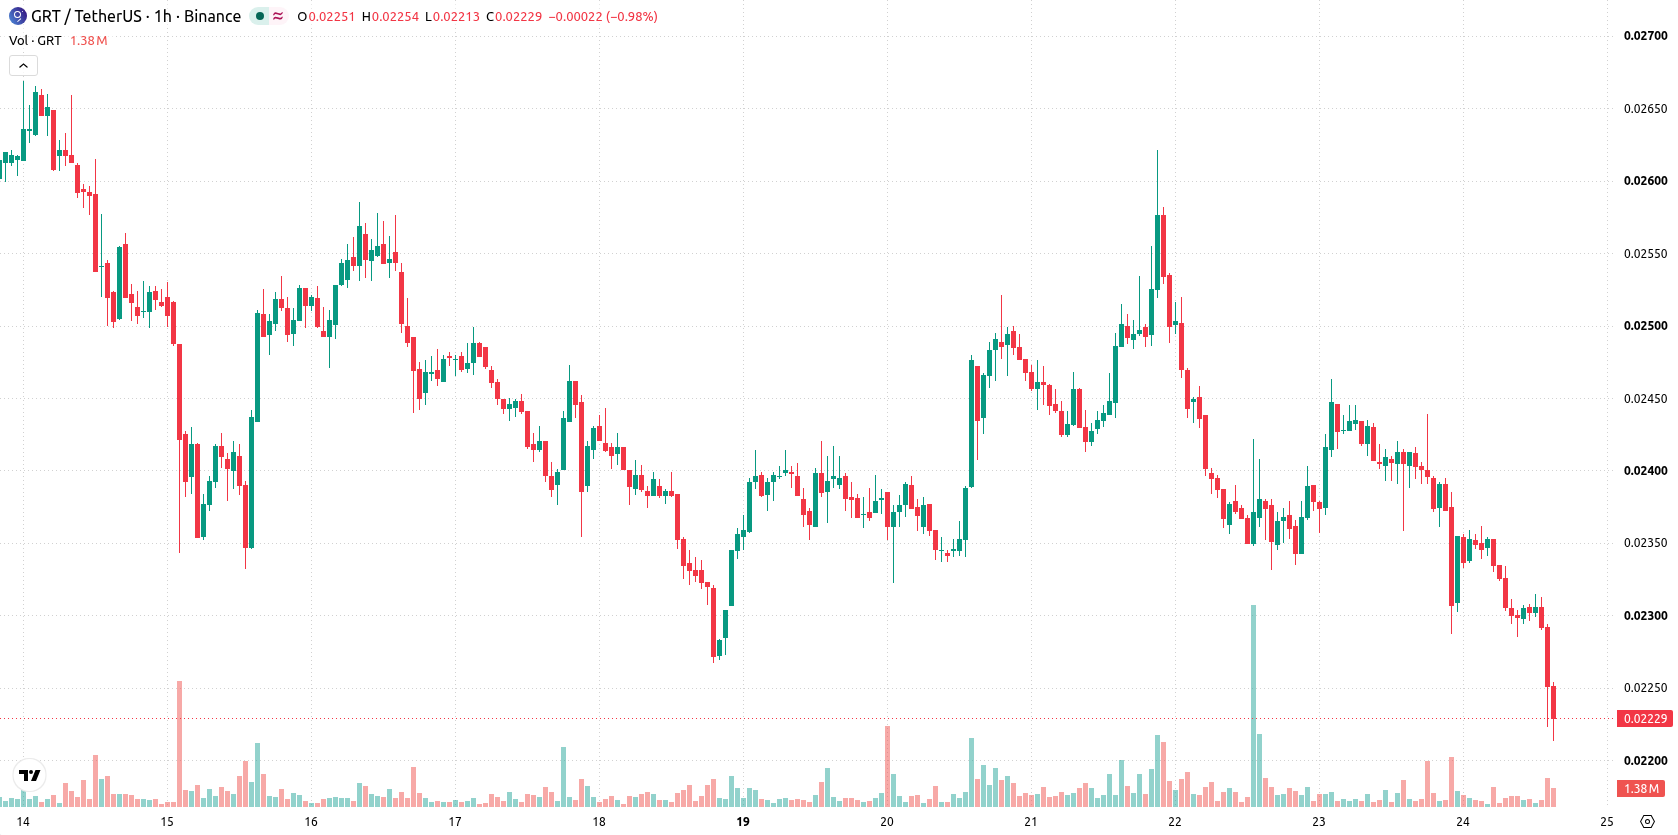
The Graph (GRT) is trading at $0.02236, down 6.91% for the day. The price is positioned below its key short- and medium-term moving averages, while remaining above its principal long-term average.
 0.02078
0.02329000
Highlights
- GRT/USD is under short- and medium-term bearish pressure, trading below key moving averages on the hourly chart.
- Momentum indicators such as MACD, ADX, and Bull/Bear Power point to continued selling dominance, with intraday price down 6.91% to $0.02236.
- Price is expected to consolidate between $0.02156843 and $0.02315157, with a low probability of upward movement and risk of further declines if support breaks.
Oversold signals persist as sellers dominate technical outlook
GRT/USD is trading below the MA-20 and MA-50 on the H1 timeframe, while remaining above the MA-200 on the daily chart. The Ichimoku Kijun at $0.023595 serves as immediate resistance. Momentum indicators are confirming bearish conditions: both MACD and ADX are showing Sell signals, while RSI, Stochastic RSI, and CCI are registering in oversold zones, suggesting that sellers may be losing momentum. Bull/Bear Power continues to indicate dominance by sellers, and the Awesome Oscillator offers no clear directional bias.
Downside risk remains elevated amid limited upside scenarios
For the coming 2–3 trading days, the expected range for GRT/USD is $0.02156843 to $0.02315157. The probability of an upward move is assessed as very low, with continued downside risk considered very high. The baseline scenario is sideways consolidation inside this volatility band. A decisive break above $0.023595 would be required to activate a bullish scenario, while a breach below $0.02156843 would suggest further declines.
Earlier, analysts noted that The Graph was exhibiting sustained downside momentum with technical indicators pointing toward ongoing bearish pressure. The latest data reinforce the bearish outlook, making a break below $0.02156843 the critical level to watch for confirmation of further weakness.






Latest GRT News



-
 Afghanistan
-
 Albania
-
 Algeria
-
 Angola
-
 Argentina
-
 Armenia
-
 Australia
-
 Austria
-
 Azerbaijan
-
 Bahamas
-
 Bahrain
-
 Bangladesh
-
 Belarus
-
 Belgium
-
 Bolivia
-
 Botswana
-
 Brazil
-
 Brunei
-
 Bulgaria
-
 Cambodia
-
 Cameroon
-
 Canada
-
 Chile
-
 China
-
 Colombia
-
 Congo
-
 Costa Rica
-
 Cote d'Ivoire
-
 Croatia
-
 Cuba
-
 Cyprus
-
 Czechia
-
 DR Congo
-
 Denmark
-
 Dominican Republic
-
 Ecuador
-
 Egypt
-
 El Salvador
-
 Estonia
-
 Eswatini
-
 Ethiopia
-
 Finland
-
 France
-
 Georgia
-
 Germany
-
 Ghana
-
 Greece
-
 Haiti
-
 Hong Kong
-
 Hungary
-
 India
-
 Indonesia
-
 Iran, Islamic republic
-
 Iraq
-
 Ireland
-
 Israel
-
 Italy
-
 Jamaica
-
 Japan
-
 Jordan
-
 Kazakhstan
-
 Kenya
-
 Korea
-
 Kuwait
-
 Kyrgyzstan
-
 Laos
-
 Latvia
-
 Lebanon
-
 Lesotho
-
 Libya
-
 Lithuania
-
 Luxembourg
-
 Madagascar
-
 Malaysia
-
 Malta
-
 Mauritius
-
 Mexico
-
 Moldova
-
 Mongolia
-
 Montenegro
-
 Morocco
-
 Mozambique
-
 Myanmar
-
 Namibia
-
 Nepal
-
 Netherlands
-
 New Zealand
-
 Nigeria
-
 North Macedonia
-
 Norway
-
 Oman
-
 Pakistan
-
 Palestine
-
 Panama
-
 Papua New Guinea
-
 Paraguay
-
 Peru
-
 Philippines
-
 Poland
-
 Portugal
-
 Puerto Rico
-
 Qatar
-
 Reunion
-
 Romania
-
 Rwanda
-
 Saudi Arabia
-
 Serbia
-
 Singapore
-
 Slovakia
-
 Slovenia
-
 Somalia
-
 South Africa
-
 Spain
-
 Sri Lanka
-
 Sweden
-
 Switzerland
-
 Syria
-
 Taiwan
-
 Tajikistan
-
 Tanzania
-
 Thailand
-
 Trinidad and Tobago
-
 Tunisia
-
 Turkey
-
 UAE
-
 Uganda
-
 Ukraine
-
 United Kingdom
-
United States
-
 Uruguay
-
 Uzbekistan
-
 Venezuela
-
 Vietnam
-
 Yemen
-
 Zambia
-
 Zimbabwe
- Forex
- Crypto












