

The Graph technical analysis: Downward price move amid persistent seller pressure

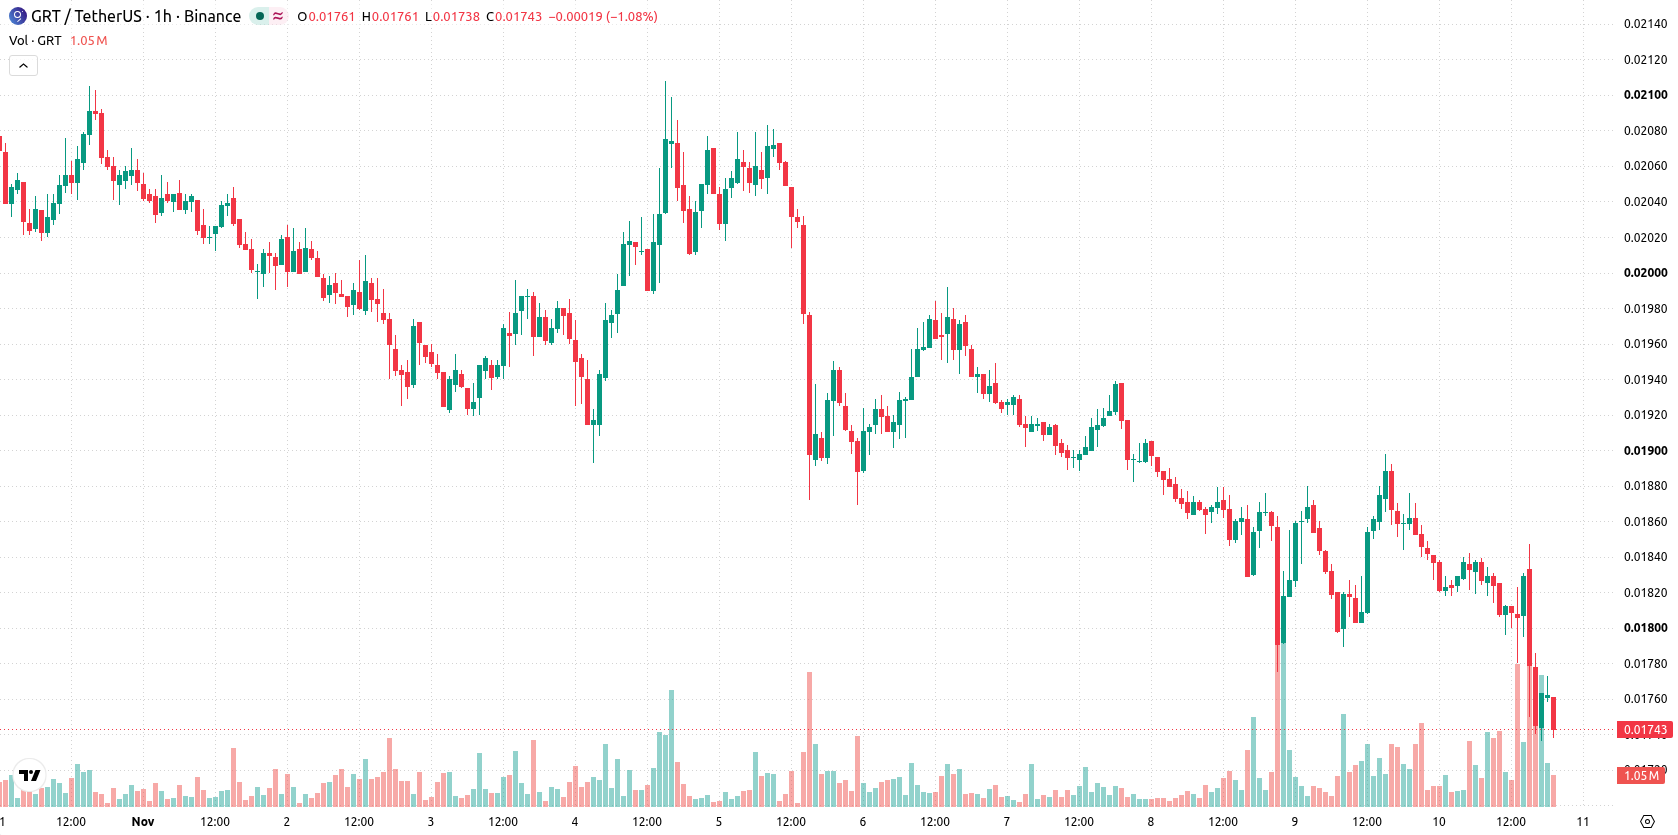
The Graph (GRT) is trading at $0.01742, down 7.14% from the previous session and near the low for the day. The price remains below its key short- and long-term moving averages, aligning with continued downside pressure.
 0.01847
0.02108000
Highlights
- GRT/USD trades below key moving averages on all timeframes, confirming sustained bearish momentum.
- Negative MACD, ADX, and oscillators confirm strong selling pressure, with price falling 7.14% to $0.01742 and volatile intraday lows.
- Price is expected to consolidate between $0.01667539 and $0.01881 over the next 2 to 3 days unless support breaks or resistance at $0.01806 is exceeded.
Sustained weakness while negative momentum and oversold signals diverge
On the technical side, GRT/USD continues to trade below the MA-20 and MA-50 on the hourly chart, and remains underneath the long-term MA-200 on the daily timeframe. The Ichimoku Kijun serves as immediate resistance at $0.01806. Momentum indicators are skewed negative, with both MACD and ADX signaling ongoing weakness, while the Awesome Oscillator also points lower. Bull/Bear Power is negative, reinforcing dominance by sellers in the current session. RSI and Stoch RSI are neutral, but CCI is oversold, indicating a divergence among oscillators and suggesting that further downside may be less orderly amid persistent selling pressure.
Bearish continuation risk as consolidation defines short-term outlook
For the next 2–3 trading days, GRT is expected to consolidate within the $0.01667539 to $0.01881 band, reflecting typical volatility at these levels. The probability of continued downward movement is high, with limited prospects for a rebound unless the price can clear the immediate $0.01806 resistance. A sustained move below the lower boundary would indicate a break of support and continuation of the bearish scenario.
Earlier, analysts noted that The Graph was under sustained downside pressure with little evidence of an imminent reversal. The ongoing slide below key moving averages and persistent negative momentum in the current session strengthen the bearish scenario, with traders advised to closely monitor price action at the lower end of the consolidation range for signs of further breakdown.











-
 Afghanistan
-
 Albania
-
 Algeria
-
 Angola
-
 Argentina
-
 Armenia
-
 Australia
-
 Austria
-
 Azerbaijan
-
 Bahamas
-
 Bahrain
-
 Bangladesh
-
 Belarus
-
 Belgium
-
 Bolivia
-
 Botswana
-
 Brazil
-
 Brunei
-
 Bulgaria
-
 Cambodia
-
 Cameroon
-
 Canada
-
 Chile
-
 China
-
 Colombia
-
 Congo
-
 Costa Rica
-
 Cote d'Ivoire
-
 Croatia
-
 Cuba
-
 Cyprus
-
 Czechia
-
 DR Congo
-
 Denmark
-
 Dominican Republic
-
 Ecuador
-
 Egypt
-
 El Salvador
-
 Estonia
-
 Eswatini
-
 Ethiopia
-
 Finland
-
 France
-
 Georgia
-
 Germany
-
 Ghana
-
 Greece
-
 Haiti
-
 Hong Kong
-
 Hungary
-
 India
-
 Indonesia
-
 Iran, Islamic republic
-
 Iraq
-
 Ireland
-
 Israel
-
 Italy
-
 Jamaica
-
 Japan
-
 Jordan
-
 Kazakhstan
-
 Kenya
-
 Korea
-
 Kuwait
-
 Kyrgyzstan
-
 Laos
-
 Latvia
-
 Lebanon
-
 Lesotho
-
 Libya
-
 Lithuania
-
 Luxembourg
-
 Madagascar
-
 Malaysia
-
 Malta
-
 Mauritius
-
 Mexico
-
 Moldova
-
 Mongolia
-
 Montenegro
-
 Morocco
-
 Mozambique
-
 Myanmar
-
 Namibia
-
 Nepal
-
 Netherlands
-
 New Zealand
-
 Nigeria
-
 North Macedonia
-
 Norway
-
 Oman
-
 Pakistan
-
 Palestine
-
 Panama
-
 Papua New Guinea
-
 Paraguay
-
 Peru
-
 Philippines
-
 Poland
-
 Portugal
-
 Puerto Rico
-
 Qatar
-
 Reunion
-
 Romania
-
 Rwanda
-
 Saudi Arabia
-
 Serbia
-
 Singapore
-
 Slovakia
-
 Slovenia
-
 Somalia
-
 South Africa
-
 Spain
-
 Sri Lanka
-
 Sweden
-
 Switzerland
-
 Syria
-
 Taiwan
-
 Tajikistan
-
 Tanzania
-
 Thailand
-
 Trinidad and Tobago
-
 Tunisia
-
 Turkey
-
 UAE
-
 Uganda
-
 Ukraine
-
 United Kingdom
-
United States
-
 Uruguay
-
 Uzbekistan
-
 Venezuela
-
 Vietnam
-
 Yemen
-
 Zambia
-
 Zimbabwe
- Forex
- Crypto












