


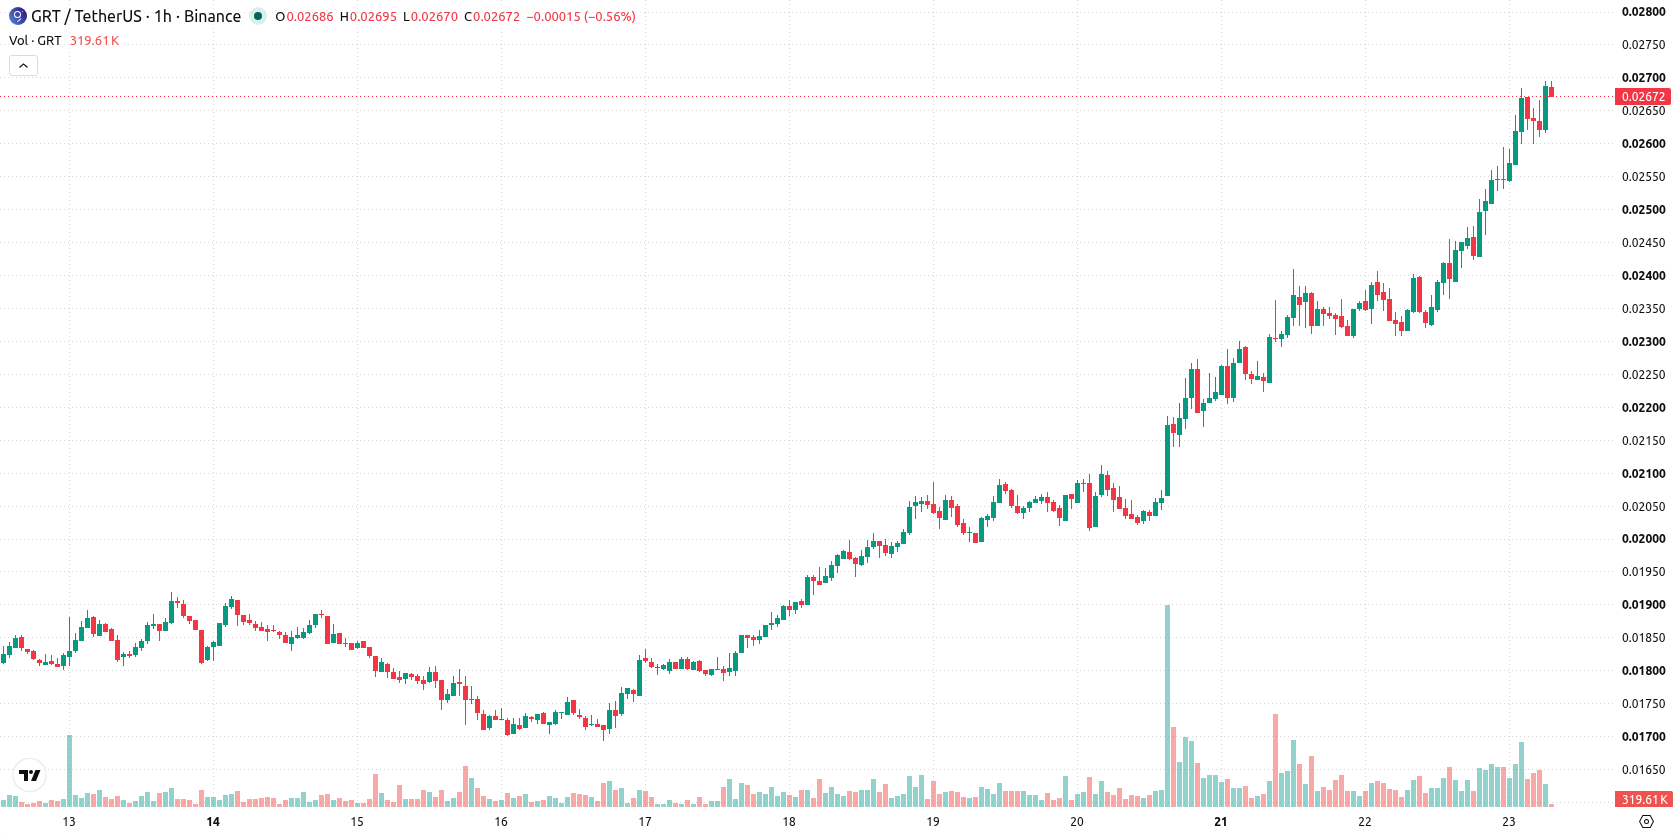
The Graph (GRT) is trading at $0.02673, up 14.62% on the day, following a strong upward move. The price holds above its key moving averages, reflecting positive short, medium, and long-term momentum.
 0.0242
0.02713000
Highlights
- Price trades above short, medium, and long-term moving averages, confirming strong bullish momentum across all timeframes.
- Momentum and trend indicators confirm buyer dominance, with overbought readings across multiple oscillators and no signals countering the move.
- Price surged 14.62% to $0.02673 and is expected to trade between $0.02491655 to $0.02854345 in the next 2 to 3 days.
Overbought signals intensify as buyers dominate technical landscape
On the technical front, GRT is trading above the MA-20 and MA-50 on the hourly timeframe, as well as above the MA-200 on the daily chart. Ichimoku Kijun at $0.024955 is acting as immediate support. Momentum indicators remain strong, with MACD and ADX both on buy signals. RSI, Stoch RSI, and CCI are all indicating overbought conditions, highlighting persistent buyer dominance. Bull/Bear Power also points to buyers controlling intraday momentum, while the Awesome Oscillator is currently neutral.
Upside outlook prevails as price volatility remains low
Over the next 2–3 trading days, the expected price range for GRT is $0.02491655 to $0.02854345. The likelihood of further upside in this window is very high, while the risk of a downside move is considered very low. The baseline scenario anticipates price consolidation within this range. In a bullish scenario, a breakout above resistance could extend gains further, whereas a bearish scenario would see price fall below immediate support and trigger short-term weakness.
Earlier, analysts noted that The Graph was exhibiting strong bullish technical momentum, with buyers firmly in control across multiple timeframes. The current outlook reinforces this theme, with a high probability of further upside and an actionable range of $0.02491655 to $0.02854345 to monitor in the coming sessions.








-
 Afghanistan
-
 Albania
-
 Algeria
-
 Angola
-
 Argentina
-
 Armenia
-
 Australia
-
 Austria
-
 Azerbaijan
-
 Bahamas
-
 Bahrain
-
 Bangladesh
-
 Belarus
-
 Belgium
-
 Bolivia
-
 Botswana
-
 Brazil
-
 Brunei
-
 Bulgaria
-
 Cambodia
-
 Cameroon
-
 Canada
-
 Chile
-
 China
-
 Colombia
-
 Congo
-
 Costa Rica
-
 Cote d'Ivoire
-
 Croatia
-
 Cuba
-
 Cyprus
-
 Czechia
-
 DR Congo
-
 Denmark
-
 Dominican Republic
-
 Ecuador
-
 Egypt
-
 El Salvador
-
 Estonia
-
 Eswatini
-
 Ethiopia
-
 Finland
-
 France
-
 Georgia
-
 Germany
-
 Ghana
-
 Greece
-
 Haiti
-
 Hong Kong
-
 Hungary
-
 India
-
 Indonesia
-
 Iran, Islamic republic
-
 Iraq
-
 Ireland
-
 Israel
-
 Italy
-
 Jamaica
-
 Japan
-
 Jordan
-
 Kazakhstan
-
 Kenya
-
 Korea
-
 Kuwait
-
 Kyrgyzstan
-
 Laos
-
 Latvia
-
 Lebanon
-
 Lesotho
-
 Libya
-
 Lithuania
-
 Luxembourg
-
 Madagascar
-
 Malaysia
-
 Malta
-
 Mauritius
-
 Mexico
-
 Moldova
-
 Mongolia
-
 Montenegro
-
 Morocco
-
 Mozambique
-
 Myanmar
-
 Namibia
-
 Nepal
-
 Netherlands
-
 New Zealand
-
 Nigeria
-
 North Macedonia
-
 Norway
-
 Oman
-
 Pakistan
-
 Palestine
-
 Panama
-
 Papua New Guinea
-
 Paraguay
-
 Peru
-
 Philippines
-
 Poland
-
 Portugal
-
 Puerto Rico
-
 Qatar
-
 Reunion
-
 Romania
-
 Rwanda
-
 Saudi Arabia
-
 Serbia
-
 Singapore
-
 Slovakia
-
 Slovenia
-
 Somalia
-
 South Africa
-
 Spain
-
 Sri Lanka
-
 Sweden
-
 Switzerland
-
 Syria
-
 Taiwan
-
 Tajikistan
-
 Tanzania
-
 Thailand
-
 Trinidad and Tobago
-
 Tunisia
-
 Turkey
-
 UAE
-
 Uganda
-
 Ukraine
-
 United Kingdom
-
United States
-
 Uruguay
-
 Uzbekistan
-
 Venezuela
-
 Vietnam
-
 Yemen
-
 Zambia
-
 Zimbabwe
- Forex
- Crypto












