


Bullish technical momentum propelled The Graph (GRT) higher by 10.09% today, supported by strong buying pressure and elevated momentum indicators. The move is confirmed by its position above the 20-day, 50-day, and 200-day moving averages, which signals robust trend strength across all timeframes.
 0.02669
0.02844000
0.02669
0.02844000
Highlights
- GRT/USD trades above short, medium, and long-term moving averages, indicating sustained bullish momentum across timeframes.
- Technical momentum indicators confirm strong upward pressure, but pronounced overbought signals suggest a risk of near-term pullback.
- Expected five-day price range is $0.021835 to $0.02928, with support at $0.02531 and resistance at $0.02928.
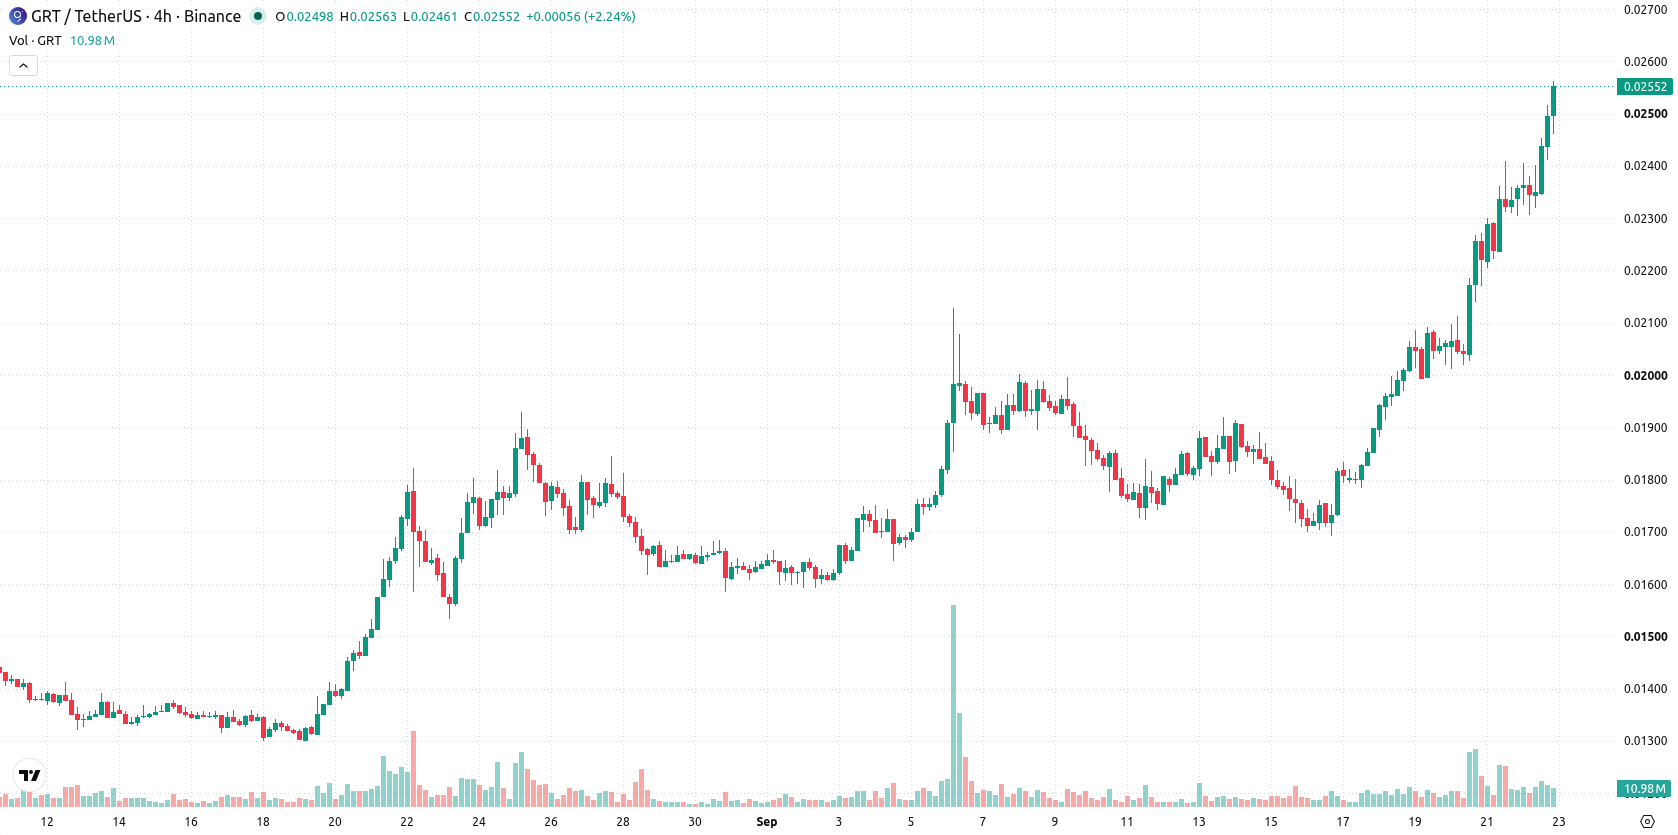
Overbought signals persist as price tests resistance on momentum
GRT/USD trades above its 20-day, 50-day, and 200-day moving averages ($0.018859, $0.0166858, and $0.0209767 respectively), signaling bullish momentum across short, medium, and long-term timeframes. The near-term floor is set at $0.02531 with resistance at $0.02928, while the longer-term moving averages below confirm underlying trend strength even as the MA-50 remains below the MA-200. Momentum signals are distinctly strong: the Moving Average Convergence Divergence (MACD) and Average Directional Index (ADX) both indicate bullish momentum. The Relative Strength Index (RSI) at 76.31, Stochastic RSI at 100, and Commodity Channel Index (CCI) at 236 show pronounced overbought conditions. Bull/Bear Power (BBP) is positive, confirming intraday buyer dominance alongside the Awesome Oscillator, which also points upward. GRT/USD advanced by $0.00233 or 10.09% today with an upside gap of around 2.12%. Price trades near the daily high within a range of $0.02307 to $0.02531, and intraday volatility stands at 9.71%. The overall tone is strong toward the highs on robust momentum.
Earlier, analysts noted that The Graph was exhibiting strong technical momentum and persistent buying pressure, cautioning that overbought conditions might prompt a short-term pause. The latest technical signals reinforce the bullish outlook, with traders advised to monitor the potential for a breakout above $0.02928 as the next major development.











-
 Afghanistan
-
 Albania
-
 Algeria
-
 Angola
-
 Argentina
-
 Armenia
-
 Australia
-
 Austria
-
 Azerbaijan
-
 Bahamas
-
 Bahrain
-
 Bangladesh
-
 Belarus
-
 Belgium
-
 Bolivia
-
 Botswana
-
 Brazil
-
 Brunei
-
 Bulgaria
-
 Cambodia
-
 Cameroon
-
 Canada
-
 Chile
Chile
-
 China
China
-
 Colombia
-
 Congo
Congo
-
 Costa Rica
-
 Cote d'Ivoire
-
 Croatia
-
 Cuba
Cuba
-
 Cyprus
-
 Czechia
-
 DR Congo
-
 Denmark
-
 Dominican Republic
-
 Ecuador
-
 Egypt
Egypt
-
 El Salvador
-
 Estonia
-
 Eswatini
-
 Ethiopia
-
 Finland
-
 France
-
 Georgia
-
 Germany
-
 Ghana
Ghana
-
 Greece
-
 Haiti
Haiti
-
 Hong Kong
-
 Hungary
-
 India
India
-
 Indonesia
-
 Iran, Islamic republic
-
 Iraq
Iraq
-
 Ireland
-
 Israel
-
 Italy
Italy
-
 Jamaica
-
 Japan
Japan
-
 Jordan
-
 Kazakhstan
-
 Kenya
Kenya
-
 Korea
Korea
-
 Kuwait
-
 Kyrgyzstan
-
 Laos
Laos
-
 Latvia
-
 Lebanon
-
 Lesotho
-
 Libya
Libya
-
 Lithuania
-
 Luxembourg
-
 Madagascar
-
 Malaysia
-
 Malta
Malta
-
 Mauritius
-
 Mexico
-
 Moldova
-
 Mongolia
-
 Montenegro
-
 Morocco
-
 Mozambique
-
 Myanmar
-
 Namibia
-
 Nepal
Nepal
-
 Netherlands
-
 New Zealand
-
 Nigeria
-
 North Macedonia
-
 Norway
-
 Oman
Oman
-
 Pakistan
-
 Palestine
-
 Panama
-
 Papua New Guinea
-
 Paraguay
-
 Peru
Peru
-
 Philippines
-
 Poland
-
 Portugal
-
 Puerto Rico
-
 Qatar
Qatar
-
 Reunion
-
 Romania
-
 Rwanda
-
 Saudi Arabia
-
 Serbia
-
 Singapore
-
 Slovakia
-
 Slovenia
-
 Somalia
-
 South Africa
-
 Spain
Spain
-
 Sri Lanka
-
 Sweden
-
 Switzerland
-
 Syria
Syria
-
 Taiwan
-
 Tajikistan
-
 Tanzania
-
 Thailand
-
 Trinidad and Tobago
-
 Tunisia
-
 Turkey
-
 UAE
UAE
-
 Uganda
-
 Ukraine
-
 United Kingdom
-
United States
-
 Uruguay
-
 Uzbekistan
-
 Venezuela
-
 Vietnam
-
 Yemen
Yemen
-
 Zambia
-
 Zimbabwe
- Forex
- Crypto












