

GRT slides around 10.5% as price nears daily low amid volatile, seller-driven session

The Graph (GRT) fell 10.5% as a wave of selling pressure dominated after a bearish open, with intraday losses driving the price near today's low. This move contradicts technical signals that show bullish momentum persisting above key moving averages and positive momentum indicators.
 0.0196
0.02314000
Highlights
- GRT/USD is trading above key moving averages, signaling buyers are dominating across multiple timeframes despite early session weakness.
- Upside targets lie at $0.02643 with $0.0247 as immediate support, while the expected five-day range is $0.020235 to $0.03197.
- Momentum indicators show a stretched rally with overbought signals, but intraday volatility remains elevated at 7% after a sharp downside gap.
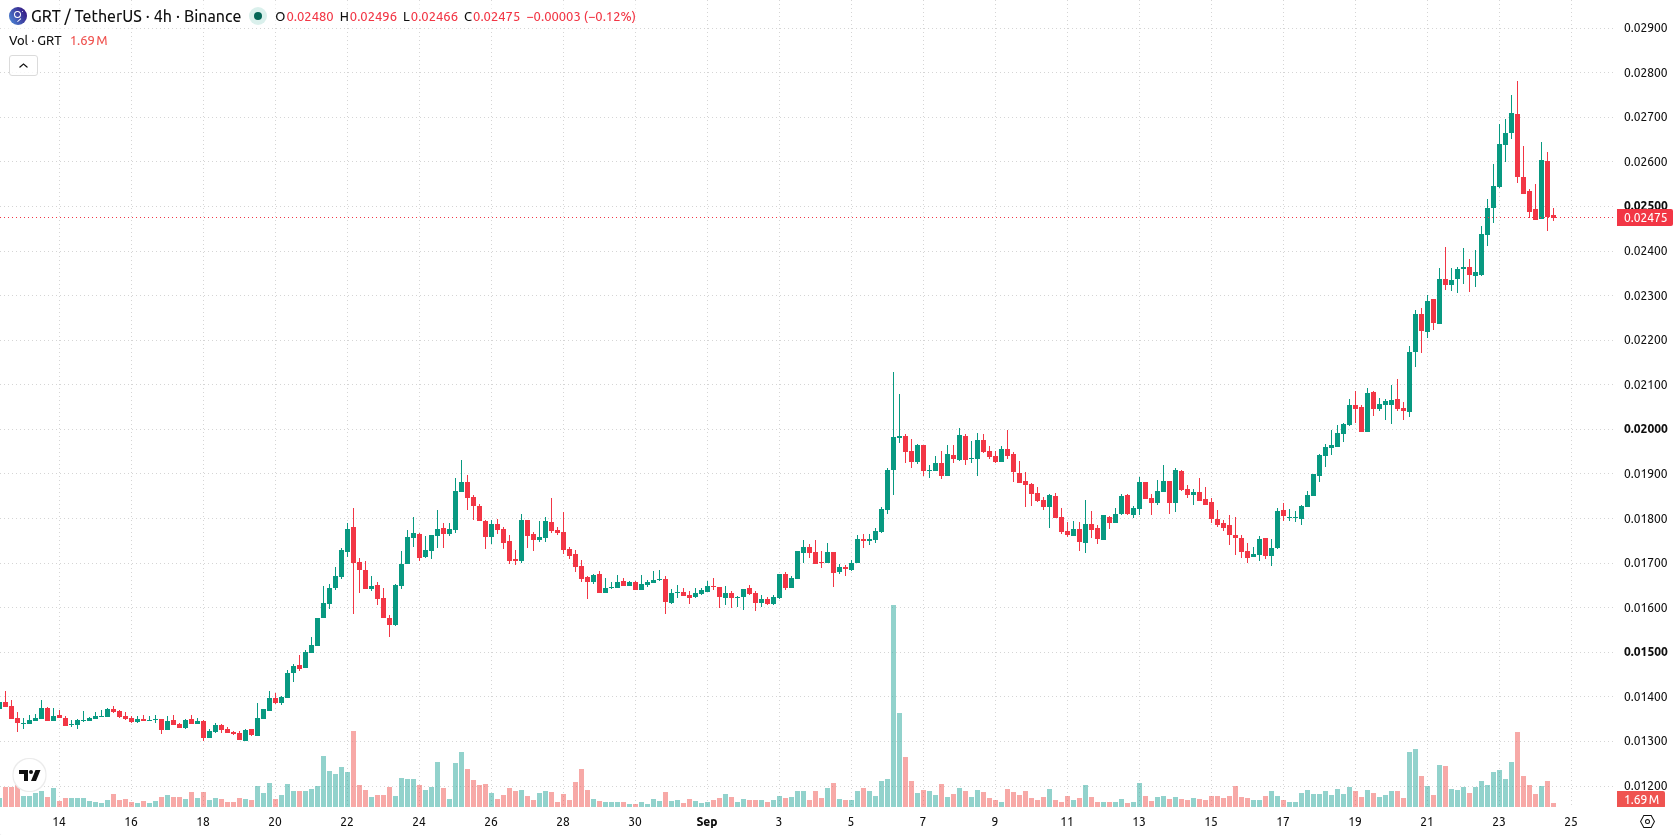
Overbought conditions intensify as support holds despite seller pressure
GRT/USD is trading above the 20-day ($0.0197125), 50-day ($0.0171082), and 200-day ($0.0209756) moving averages, signaling continued bullish momentum across short, medium, and long timeframes. The alignment between the 50-day and 200-day averages remains bearish, but the current price shows buyers in control, with $0.02643 as the near-term ceiling and $0.0247 as the near-term floor. The Ichimoku Kijun at $0.02183 is acting as additional support. Momentum indicators are strong: the MACD and ADX both indicate a buy signal. The RSI, Stochastic RSI, and CCI are deep into overbought territory, suggesting the rally is stretched. Bull/Bear Power (BBP) shows buyers dominating intraday momentum, which aligns with an overbought signal. The Awesome Oscillator also confirms bullish momentum. After opening with a downside gap of about $0.0027 (down 9.77%), the price has dropped $0.0029 or 10.5%, now trading near today’s low. Intraday volatility stands at 7.00%. The tone is weak, with sellers pressuring the pair after the open, which diverges from the generally bullish momentum signals.
Earlier, analysts noted that The Graph had shifted into a consolidation phase, with the market closely watching for a break from key technical levels. The current setup introduces increased volatility and a strong directional bias, making the $0.02643 resistance a critical threshold for traders to monitor in the near term.











-
 Afghanistan
-
 Albania
-
 Algeria
-
 Angola
-
 Argentina
-
 Armenia
-
 Australia
-
 Austria
-
 Azerbaijan
-
 Bahamas
-
 Bahrain
-
 Bangladesh
-
 Belarus
-
 Belgium
-
 Bolivia
-
 Botswana
-
 Brazil
-
 Brunei
-
 Bulgaria
-
 Cambodia
-
 Cameroon
-
 Canada
-
 Chile
-
 China
-
 Colombia
-
 Congo
-
 Costa Rica
-
 Cote d'Ivoire
-
 Croatia
-
 Cuba
-
 Cyprus
-
 Czechia
-
 DR Congo
-
 Denmark
-
 Dominican Republic
-
 Ecuador
-
 Egypt
-
 El Salvador
-
 Estonia
-
 Eswatini
-
 Ethiopia
-
 Finland
-
 France
-
 Georgia
-
 Germany
-
 Ghana
-
 Greece
-
 Haiti
-
 Hong Kong
-
 Hungary
-
 India
-
 Indonesia
-
 Iran, Islamic republic
-
 Iraq
-
 Ireland
-
 Israel
-
 Italy
-
 Jamaica
-
 Japan
-
 Jordan
-
 Kazakhstan
-
 Kenya
-
 Korea
-
 Kuwait
-
 Kyrgyzstan
-
 Laos
-
 Latvia
-
 Lebanon
-
 Lesotho
-
 Libya
-
 Lithuania
-
 Luxembourg
-
 Madagascar
-
 Malaysia
-
 Malta
-
 Mauritius
-
 Mexico
-
 Moldova
-
 Mongolia
-
 Montenegro
-
 Morocco
-
 Mozambique
-
 Myanmar
-
 Namibia
-
 Nepal
-
 Netherlands
-
 New Zealand
-
 Nigeria
-
 North Macedonia
-
 Norway
-
 Oman
-
 Pakistan
-
 Palestine
-
 Panama
-
 Papua New Guinea
-
 Paraguay
-
 Peru
-
 Philippines
-
 Poland
-
 Portugal
-
 Puerto Rico
-
 Qatar
-
 Reunion
-
 Romania
-
 Rwanda
-
 Saudi Arabia
-
 Serbia
-
 Singapore
-
 Slovakia
-
 Slovenia
-
 Somalia
-
 South Africa
-
 Spain
-
 Sri Lanka
-
 Sweden
-
 Switzerland
-
 Syria
-
 Taiwan
-
 Tajikistan
-
 Tanzania
-
 Thailand
-
 Trinidad and Tobago
-
 Tunisia
-
 Turkey
-
 UAE
-
 Uganda
-
 Ukraine
-
 United Kingdom
-
United States
-
 Uruguay
-
 Uzbekistan
-
 Venezuela
-
 Vietnam
-
 Yemen
-
 Zambia
-
 Zimbabwe
- Forex
- Crypto












