

Why is The Graph up today? Studio migration and x402 integration ignite buyer support

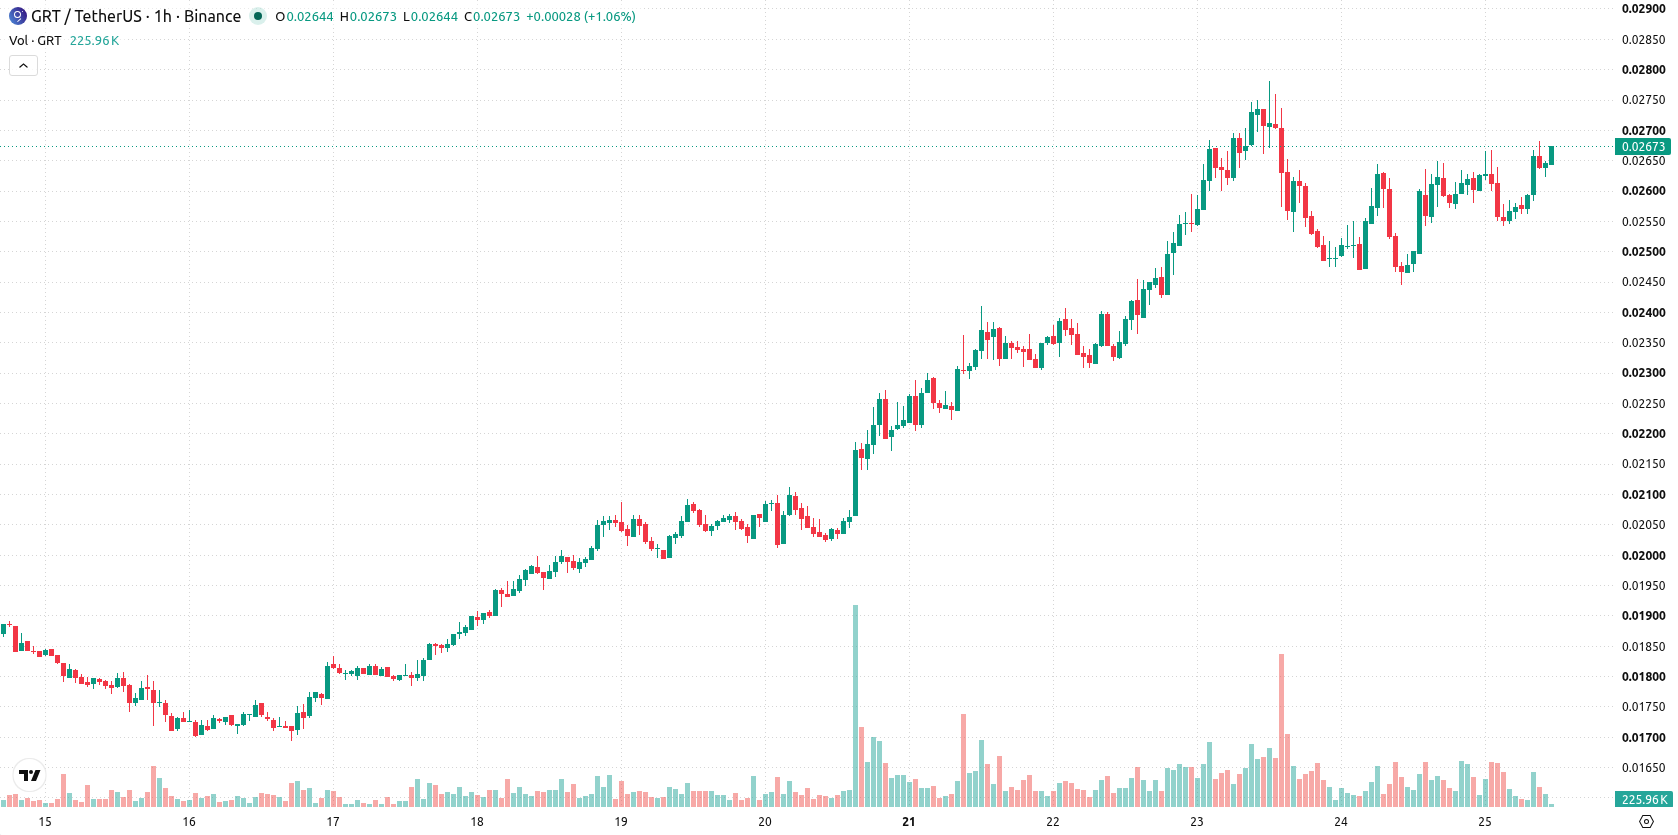
The Graph (GRT) is trading at $0.02664, advancing 7.99% over the last 24 hours. The price is currently positioned above its key moving averages, indicating solid momentum for the session.
 0.02027
0.02314000
Highlights
- The Graph Foundation will transition all Subgraph Studio traffic to its decentralized network by October 8, 2026, starting with BNB Smart Chain and Polygon.
- Integration with the x402 payment protocol enables developers to pay per data query, expanding payment choices and accessibility.
- GRT trades with strong bullish short- and medium-term momentum, with price up 7.99% at $0.02664 and a very high probability of further upside toward the $0.0284 level within the next 2 to 3 days.
Utility expansion as decentralization and new payment options drive demand
The Graph Foundation has confirmed that all Subgraph Studio traffic will be transitioned to its decentralized network, a process starting with BNB Smart Chain and Polygon and requiring full migration by October 8, 2026. This move is expected to bolster demand for GRT by increasing utility and deepening decentralization across the ecosystem, as ongoing network upgrades typically drive usage and confidence among participants. Additionally, the recent integration with the x402 payment protocol allows developers to pay per Blockchain data query rather than through subscriptions, according to The Graph Foundation, broadening payment options and making the platform more accessible.
Bullish signals as technical indicators show strong but formative trend
GRT/USD currently trades above the MA-20 and MA-50 on the H1 timeframe and remains well above the daily MA-200. The Ichimoku Kijun is positioned at $0.025625, serving as immediate support. MACD signals a buy, reflecting ongoing upside momentum, while ADX remains neutral, indicating a trend that is forming but not yet fully established. RSI and CCI show moderate buying activity without breaching overbought levels, and Stoch RSI is neutral. Bull/Bear Power reflects active buyer dominance during the current intraday session, and the Awesome Oscillator directionally supports the upward move.
Upside bias as volatility range anchors short-term outlook
Over the next two to three trading days, GRT/USD is expected to fluctuate within a volatility band between $0.02487798 and $0.02840202. There is a very high probability (above 80%) of further upside movement within this range. If the price breaks above resistance, gains may accelerate, while a sustained move below immediate support could signal further downside risk.
Earlier, analysts noted that The Graph's price action was marked by heightened volatility and a consolidation phase around key technical levels. The current outlook expands on this by highlighting ongoing momentum and upcoming network upgrades, positioning the $0.02840 resistance as a crucial threshold to monitor for potential upside acceleration.









-
 Afghanistan
-
 Albania
-
 Algeria
-
 Angola
-
 Argentina
-
 Armenia
-
 Australia
-
 Austria
-
 Azerbaijan
-
 Bahamas
-
 Bahrain
-
 Bangladesh
-
 Belarus
-
 Belgium
-
 Bolivia
-
 Botswana
-
 Brazil
-
 Brunei
-
 Bulgaria
-
 Cambodia
-
 Cameroon
-
 Canada
-
 Chile
-
 China
-
 Colombia
-
 Congo
-
 Costa Rica
-
 Cote d'Ivoire
-
 Croatia
-
 Cuba
-
 Cyprus
-
 Czechia
-
 DR Congo
-
 Denmark
-
 Dominican Republic
-
 Ecuador
-
 Egypt
-
 El Salvador
-
 Estonia
-
 Eswatini
-
 Ethiopia
-
 Finland
-
 France
-
 Georgia
-
 Germany
-
 Ghana
-
 Greece
-
 Haiti
-
 Hong Kong
-
 Hungary
-
 India
-
 Indonesia
-
 Iran, Islamic republic
-
 Iraq
-
 Ireland
-
 Israel
-
 Italy
-
 Jamaica
-
 Japan
-
 Jordan
-
 Kazakhstan
-
 Kenya
-
 Korea
-
 Kuwait
-
 Kyrgyzstan
-
 Laos
-
 Latvia
-
 Lebanon
-
 Lesotho
-
 Libya
-
 Lithuania
-
 Luxembourg
-
 Madagascar
-
 Malaysia
-
 Malta
-
 Mauritius
-
 Mexico
-
 Moldova
-
 Mongolia
-
 Montenegro
-
 Morocco
-
 Mozambique
-
 Myanmar
-
 Namibia
-
 Nepal
-
 Netherlands
-
 New Zealand
-
 Nigeria
-
 North Macedonia
-
 Norway
-
 Oman
-
 Pakistan
-
 Palestine
-
 Panama
-
 Papua New Guinea
-
 Paraguay
-
 Peru
-
 Philippines
-
 Poland
-
 Portugal
-
 Puerto Rico
-
 Qatar
-
 Reunion
-
 Romania
-
 Rwanda
-
 Saudi Arabia
-
 Serbia
-
 Singapore
-
 Slovakia
-
 Slovenia
-
 Somalia
-
 South Africa
-
 Spain
-
 Sri Lanka
-
 Sweden
-
 Switzerland
-
 Syria
-
 Taiwan
-
 Tajikistan
-
 Tanzania
-
 Thailand
-
 Trinidad and Tobago
-
 Tunisia
-
 Turkey
-
 UAE
-
 Uganda
-
 Ukraine
-
 United Kingdom
-
United States
-
 Uruguay
-
 Uzbekistan
-
 Venezuela
-
 Vietnam
-
 Yemen
-
 Zambia
-
 Zimbabwe
- Forex
- Crypto












