


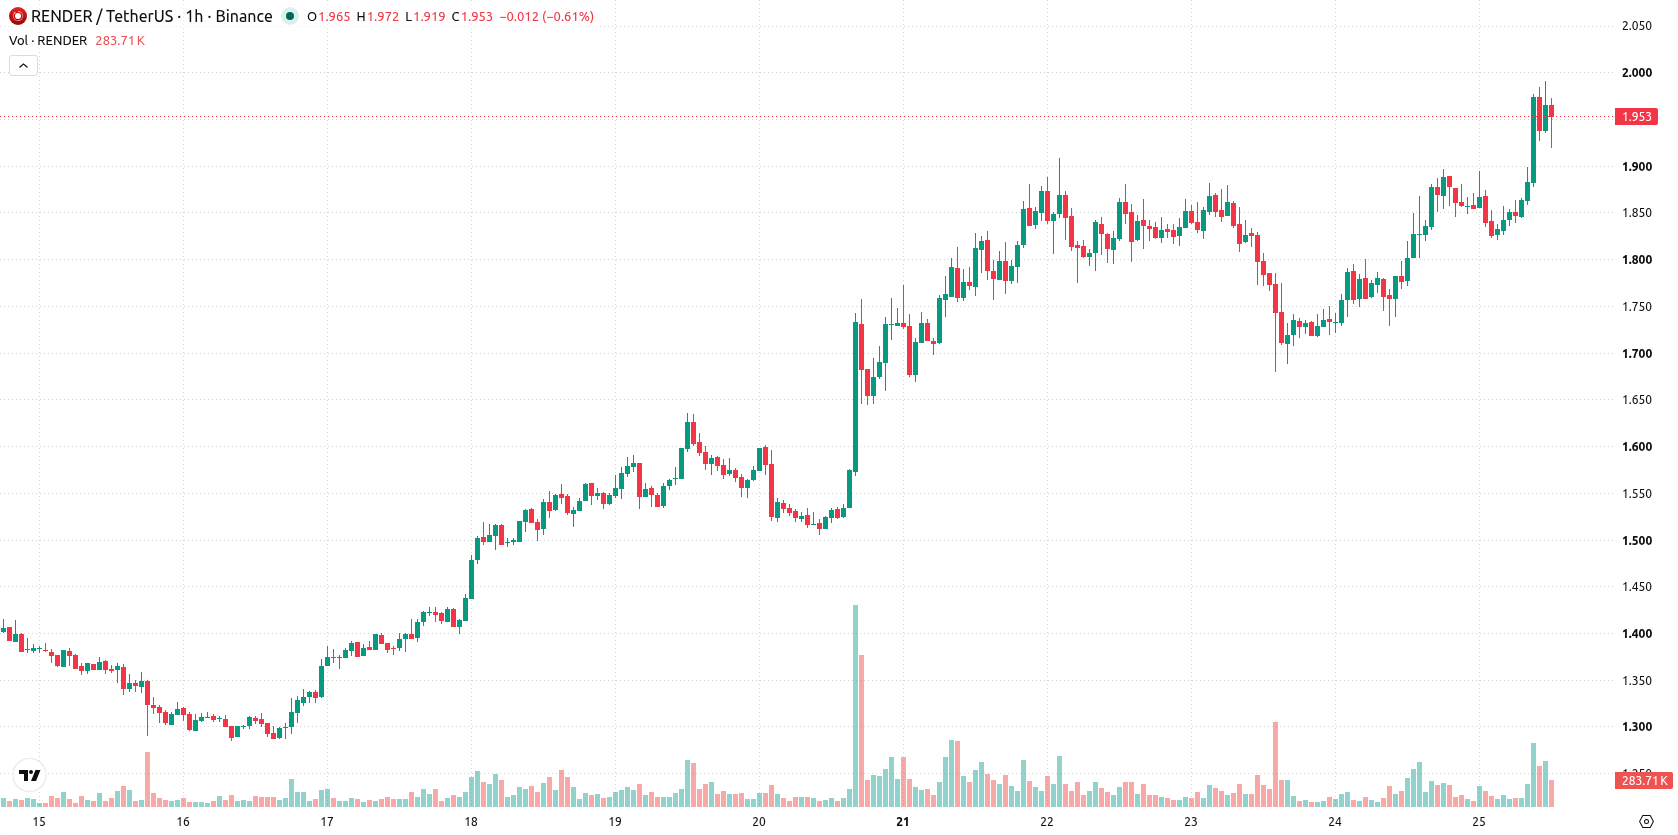
Render (RENDER) is trading at $1.953 after climbing 8.86% on the day, with strong momentum near the session high. The asset sits above its key moving averages, signaling robust support across multiple timeframes.
 1.369
1.6400
Highlights
- Render trades firmly above short-, medium-, and long-term moving averages, confirming strong bullish momentum across all timeframes.
- Momentum indicators such as MACD, ADX, and Stoch RSI align on buy signals, but RSI and CCI readings indicate the market is overbought.
- Price is up 8.86% at $1.953, with an expected 1 to 2 day trading range of $1.8629 to $2.0431 and a high probability of continued upside.
Technical buying power intensifies as overbought signals cluster
On the hourly chart, RNDR trades above the MA-20 at $1.8732 and the MA-50 at $1.8086, with long-term backing from the MA-200 at $1.6584. The Ichimoku Kijun currently provides immediate support at $1.8645. Momentum indicators including MACD, ADX, and Stochastic RSI all flash Buy signals, while RSI reads 69.1 and CCI also indicates an overbought condition. Bull/Bear Power and the Awesome Oscillator both reflect pronounced buyer dominance and trend strength.
Sideways action expected as volatility narrows and upside risk remains
Over the next 1–2 trading days, RNDR is likely to move within a volatility band of $1.8629 to $2.0431. The probability of further upward movement is very high, with a down move appearing very unlikely. The baseline scenario suggests sideways consolidation inside this corridor, but a decisive break above resistance could open further upside, while a fall below support may trigger a short-term pullback.
Earlier, analysts noted that Render was entering a bullish phase supported by strengthening momentum and a positive technical structure. The current analysis reinforces this outlook with stronger buy signals across multiple indicators, highlighting the importance of monitoring any sustained move above resistance for potential further gains.










-
 Afghanistan
-
 Albania
-
 Algeria
-
 Angola
-
 Argentina
-
 Armenia
-
 Australia
-
 Austria
-
 Azerbaijan
-
 Bahamas
-
 Bahrain
-
 Bangladesh
-
 Belarus
-
 Belgium
-
 Bolivia
-
 Botswana
-
 Brazil
-
 Brunei
-
 Bulgaria
-
 Cambodia
-
 Cameroon
-
 Canada
-
 Chile
-
 China
-
 Colombia
-
 Congo
-
 Costa Rica
-
 Cote d'Ivoire
-
 Croatia
-
 Cuba
-
 Cyprus
-
 Czechia
-
 DR Congo
-
 Denmark
-
 Dominican Republic
-
 Ecuador
-
 Egypt
-
 El Salvador
-
 Estonia
-
 Eswatini
-
 Ethiopia
-
 Finland
-
 France
-
 Georgia
-
 Germany
-
 Ghana
-
 Greece
-
 Haiti
-
 Hong Kong
-
 Hungary
-
 India
-
 Indonesia
-
 Iran, Islamic republic
-
 Iraq
-
 Ireland
-
 Israel
-
 Italy
-
 Jamaica
-
 Japan
-
 Jordan
-
 Kazakhstan
-
 Kenya
-
 Korea
-
 Kuwait
-
 Kyrgyzstan
-
 Laos
-
 Latvia
-
 Lebanon
-
 Lesotho
-
 Libya
-
 Lithuania
-
 Luxembourg
-
 Madagascar
-
 Malaysia
-
 Malta
-
 Mauritius
-
 Mexico
-
 Moldova
-
 Mongolia
-
 Montenegro
-
 Morocco
-
 Mozambique
-
 Myanmar
-
 Namibia
-
 Nepal
-
 Netherlands
-
 New Zealand
-
 Nigeria
-
 North Macedonia
-
 Norway
-
 Oman
-
 Pakistan
-
 Palestine
-
 Panama
-
 Papua New Guinea
-
 Paraguay
-
 Peru
-
 Philippines
-
 Poland
-
 Portugal
-
 Puerto Rico
-
 Qatar
-
 Reunion
-
 Romania
-
 Rwanda
-
 Saudi Arabia
-
 Serbia
-
 Singapore
-
 Slovakia
-
 Slovenia
-
 Somalia
-
 South Africa
-
 Spain
-
 Sri Lanka
-
 Sweden
-
 Switzerland
-
 Syria
-
 Taiwan
-
 Tajikistan
-
 Tanzania
-
 Thailand
-
 Trinidad and Tobago
-
 Tunisia
-
 Turkey
-
 UAE
-
 Uganda
-
 Ukraine
-
 United Kingdom
-
United States
-
 Uruguay
-
 Uzbekistan
-
 Venezuela
-
 Vietnam
-
 Yemen
-
 Zambia
-
 Zimbabwe
- Forex
- Crypto












