

Render price outlook: Rebound faces test at $2.209 resistance

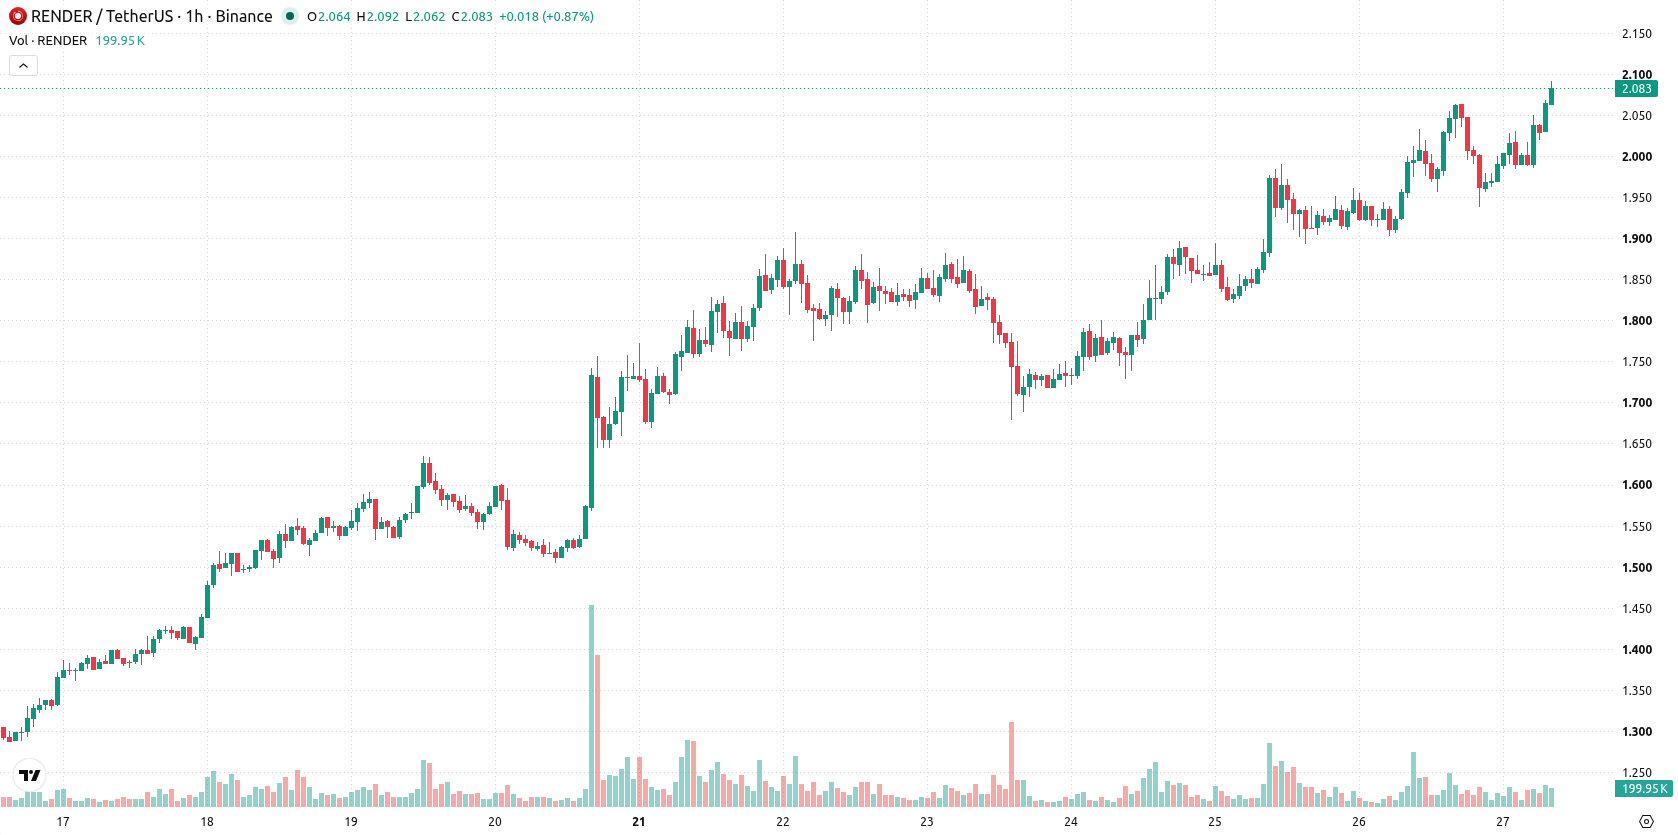
Render (RENDER) is trading at $2.081, up 6.39% on the day. The price sits above its key moving averages, highlighting sustained upward momentum.
 1.594
1.7400
Highlights
- Render (RNDR) trades above key short-, medium-, and long-term moving averages, confirming bullish momentum across multiple timeframes.
- Momentum indicators including MACD, ADX, and CCI support a buy setup, but Stoch RSI indicates overbought conditions and potential short-term overheating.
- Price is up 6.39% to $2.081 with a projected 2 to 3 day range of $1.9927 to $2.209, with upside probability classified as very high.
Bullish signals reinforced by intraday support and overbought stochastics
On the technical side, RENDER is trading above the MA-20 ($2.0073) and MA-50 ($1.9637) on the hourly chart, as well as the MA-200 ($1.6637) on the daily timeframe. The Ichimoku Kijun line at $1.9855 marks immediate support. MACD and ADX both point to a buy setup, while RSI reads 58.977 (buy) and CCI also remains positive. Meanwhile, Stoch RSI is overbought, indicating short-term overheating, but Bull/Bear Power confirms buyers dominate intraday action, with the Awesome Oscillator supporting the positive momentum.
Upside breakout risk increases amid tight trading range
In the short term, the expected trading range for RENDER over the next 2–3 sessions is $1.9927 to $2.209. The probability of further upside is very high, with a low likelihood of reversal. Price is likely to consolidate within this volatility band relative to current levels. Should buyers accelerate, a breakout above the resistance zone could lead to further gains, while a dip below the Ichimoku Kijun support may trigger a retest of the lower end of the range.
Earlier, analysts noted that Render was entering a bullish phase backed by strong technical momentum and network developments. The latest price action and indicator signals reinforce this outlook, making the upper end of the current $1.9927–$2.209 range a key level to monitor for a potential breakout.










-
 Afghanistan
-
 Albania
-
 Algeria
-
 Angola
-
 Argentina
-
 Armenia
-
 Australia
-
 Austria
-
 Azerbaijan
-
 Bahamas
-
 Bahrain
-
 Bangladesh
-
 Belarus
-
 Belgium
-
 Bolivia
-
 Botswana
-
 Brazil
-
 Brunei
-
 Bulgaria
-
 Cambodia
-
 Cameroon
-
 Canada
-
 Chile
-
 China
-
 Colombia
-
 Congo
-
 Costa Rica
-
 Cote d'Ivoire
-
 Croatia
-
 Cuba
-
 Cyprus
-
 Czechia
-
 DR Congo
-
 Denmark
-
 Dominican Republic
-
 Ecuador
-
 Egypt
-
 El Salvador
-
 Estonia
-
 Eswatini
-
 Ethiopia
-
 Finland
-
 France
-
 Georgia
-
 Germany
-
 Ghana
-
 Greece
-
 Haiti
-
 Hong Kong
-
 Hungary
-
 India
-
 Indonesia
-
 Iran, Islamic republic
-
 Iraq
-
 Ireland
-
 Israel
-
 Italy
-
 Jamaica
-
 Japan
-
 Jordan
-
 Kazakhstan
-
 Kenya
-
 Korea
-
 Kuwait
-
 Kyrgyzstan
-
 Laos
-
 Latvia
-
 Lebanon
-
 Lesotho
-
 Libya
-
 Lithuania
-
 Luxembourg
-
 Madagascar
-
 Malaysia
-
 Malta
-
 Mauritius
-
 Mexico
-
 Moldova
-
 Mongolia
-
 Montenegro
-
 Morocco
-
 Mozambique
-
 Myanmar
-
 Namibia
-
 Nepal
-
 Netherlands
-
 New Zealand
-
 Nigeria
-
 North Macedonia
-
 Norway
-
 Oman
-
 Pakistan
-
 Palestine
-
 Panama
-
 Papua New Guinea
-
 Paraguay
-
 Peru
-
 Philippines
-
 Poland
-
 Portugal
-
 Puerto Rico
-
 Qatar
-
 Reunion
-
 Romania
-
 Rwanda
-
 Saudi Arabia
-
 Serbia
-
 Singapore
-
 Slovakia
-
 Slovenia
-
 Somalia
-
 South Africa
-
 Spain
-
 Sri Lanka
-
 Sweden
-
 Switzerland
-
 Syria
-
 Taiwan
-
 Tajikistan
-
 Tanzania
-
 Thailand
-
 Trinidad and Tobago
-
 Tunisia
-
 Turkey
-
 UAE
-
 Uganda
-
 Ukraine
-
 United Kingdom
-
United States
-
 Uruguay
-
 Uzbekistan
-
 Venezuela
-
 Vietnam
-
 Yemen
-
 Zambia
-
 Zimbabwe
- Forex
- Crypto












