

STX slides around 9.5% as sell pressure emerges even with robust technical indicators

Stacks (STX) plunged 9.53% today as a surge in near-term selling pressure drove the drop, with downside momentum emerging in the absence of fresh catalysts. The retreat contradicts the asset's broader bullish technical posture, as price remains above key moving averages but bears took control intraday.
 0.3504
0.3990
Highlights
- STX/USD maintains a bullish structure above key moving averages across all timeframes, with support at 0.2998 and resistance at 0.32.
- Momentum indicators mostly support further upside, though overbought warnings have emerged and intraday price fell 9.53%.
- Next 5-day price range is expected between 0.2861 and 0.3461, with a high probability of an upward move.
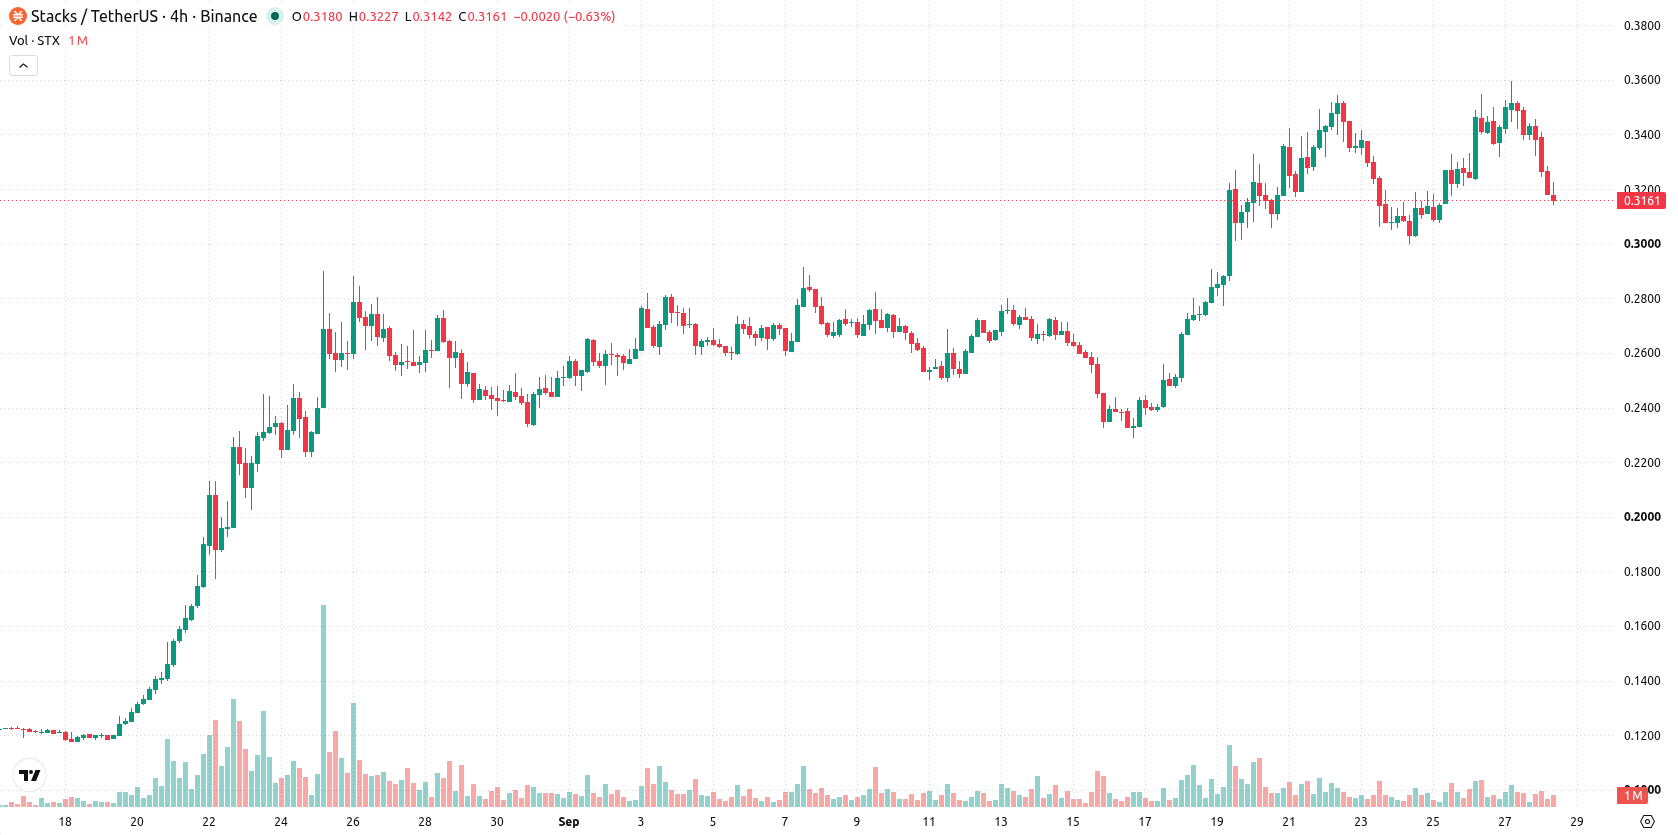
Bullish signals dominate despite volatility and overbought warning
STX/USD trades above its 20-day ($0.2912), 50-day ($0.2373), and 200-day ($0.213) moving averages, showing a consistently bullish structure across all primary timeframes. The Ichimoku Kijun at $0.2942 acts as solid support, while the bullish cross of the MA-50 over the MA-200 reaffirms the longer-term uptrend. The immediate resistance is set at $0.32, with support near $0.2998. Momentum readings remain robust: both MACD and ADX indicate further upside potential, while the RSI is elevated at 68.1, suggesting a buy bias. However, the Commodity Channel Index (CCI) points to overbought conditions, and the Stochastic RSI registers as neutral. Bull/Bear Power (BBP) at 0.047 highlights dominant intraday buyers, yet the CCI-overbought signal introduces caution. The Awesome Oscillator is neutral. Despite this positive momentum setup, price fell $0.0333 (9.53%) today amid heightened intraday volatility (6.56%), closing the session near day lows and signaling pronounced sell pressure.
Previously it was reported that Stacks exhibited strong bullish momentum, underpinned by robust technical indicators and sustained buyer interest. The current sharp pullback introduces heightened volatility into the prevailing uptrend, making the $0.2998 support level a critical marker for traders to monitor in the coming sessions.









-
 Afghanistan
-
 Albania
-
 Algeria
-
 Angola
-
 Argentina
-
 Armenia
-
 Australia
-
 Austria
-
 Azerbaijan
-
 Bahamas
-
 Bahrain
-
 Bangladesh
-
 Belarus
-
 Belgium
-
 Bolivia
-
 Botswana
-
 Brazil
-
 Brunei
-
 Bulgaria
-
 Cambodia
-
 Cameroon
-
 Canada
-
 Chile
-
 China
-
 Colombia
-
 Congo
-
 Costa Rica
-
 Cote d'Ivoire
-
 Croatia
-
 Cuba
-
 Cyprus
-
 Czechia
-
 DR Congo
-
 Denmark
-
 Dominican Republic
-
 Ecuador
-
 Egypt
-
 El Salvador
-
 Estonia
-
 Eswatini
-
 Ethiopia
-
 Finland
-
 France
-
 Georgia
-
 Germany
-
 Ghana
-
 Greece
-
 Haiti
-
 Hong Kong
-
 Hungary
-
 India
-
 Indonesia
-
 Iran, Islamic republic
-
 Iraq
-
 Ireland
-
 Israel
-
 Italy
-
 Jamaica
-
 Japan
-
 Jordan
-
 Kazakhstan
-
 Kenya
-
 Korea
-
 Kuwait
-
 Kyrgyzstan
-
 Laos
-
 Latvia
-
 Lebanon
-
 Lesotho
-
 Libya
-
 Lithuania
-
 Luxembourg
-
 Madagascar
-
 Malaysia
-
 Malta
-
 Mauritius
-
 Mexico
-
 Moldova
-
 Mongolia
-
 Montenegro
-
 Morocco
-
 Mozambique
-
 Myanmar
-
 Namibia
-
 Nepal
-
 Netherlands
-
 New Zealand
-
 Nigeria
-
 North Macedonia
-
 Norway
-
 Oman
-
 Pakistan
-
 Palestine
-
 Panama
-
 Papua New Guinea
-
 Paraguay
-
 Peru
-
 Philippines
-
 Poland
-
 Portugal
-
 Puerto Rico
-
 Qatar
-
 Reunion
-
 Romania
-
 Rwanda
-
 Saudi Arabia
-
 Serbia
-
 Singapore
-
 Slovakia
-
 Slovenia
-
 Somalia
-
 South Africa
-
 Spain
-
 Sri Lanka
-
 Sweden
-
 Switzerland
-
 Syria
-
 Taiwan
-
 Tajikistan
-
 Tanzania
-
 Thailand
-
 Trinidad and Tobago
-
 Tunisia
-
 Turkey
-
 UAE
-
 Uganda
-
 Ukraine
-
 United Kingdom
-
United States
-
 Uruguay
-
 Uzbekistan
-
 Venezuela
-
 Vietnam
-
 Yemen
-
 Zambia
-
 Zimbabwe
- Forex
- Crypto












