

Will Chainlink break $15.94 resistance after ANZ Bank and Fidelity integrations?

Chainlink (LINK) is trading at $15.39, gaining 9.03% on the day. The price remains well above its key moving averages, highlighting ongoing bullish sentiment.
 11.2
12.02
Highlights
- Chainlink introduced CCIP 2.0, letting institutions customize cross-chain verifiers, policies, and settlement, expanding regulatory and operational flexibility.
- Recent integrations by ANZ Bank, Bottomline, and Fidelity International plus large holders accumulating 2.5 million LINK show increased institutional and major investor activity.
- LINK trades with strong bullish momentum and is projected to consolidate between $14.52 and $15.94 over the next 2 to 3 days.
Institutional adoption accelerates as CCIP 2.0 expands compliance tools
Chainlink has launched CCIP 2.0, a major upgrade to its cross-chain interoperability protocol, which allows institutions and token issuers to implement their own Cross-Chain Verifiers, transaction policies, and settlement options—this significantly enhances institutional appeal and protocol flexibility, according to Cryptotimes. CCIP 2.0 also debuts an Automated Compliance Engine, equipping users with compliance controls for cross-chain asset movements and supporting broader regulatory requirements. Adoption momentum is supported by recent integrations from ANZ Bank, Bottomline, and Fidelity International, as reported by Prnewswire, while Blockonomi highlights that large holders have accumulated over 2.5 million LINK in the past 10 days, signalling sustained buying interest from major market participants.
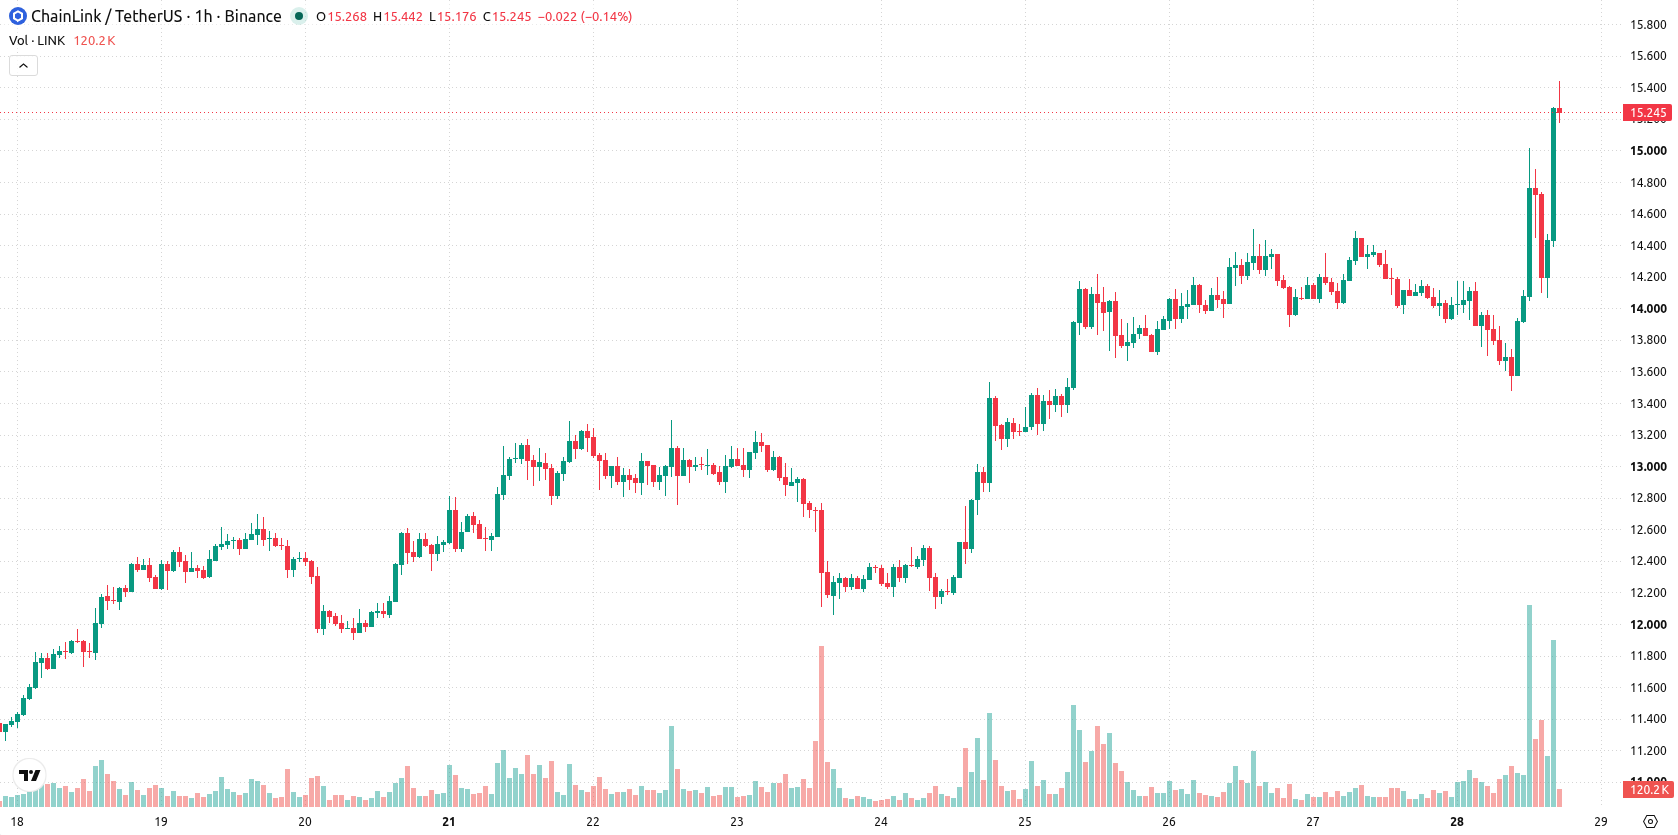
Momentum surges as LINK holds above technical support and triggers buy signals
On the hourly chart, LINK is trading above the MA-20 at $14.07, MA-50 at $14.13, and long-term MA-200 at $9.39. The Ichimoku Kijun sits at $14.25 as immediate support. Momentum indicators are strongly positive: MACD, ADX, Stoch RSI, and Awesome Oscillator all point to continued buying, while RSI stands at 61.74 and CCI signals overbought conditions. Bull/Bear Power confirms that buyers are dominating intraday action, with oscillators and trend indicators showing robust momentum and no meaningful divergence.
Upside potential prevails as volatility narrows and breakout risk emerges
Over the next 2 to 3 days, LINK is likely to trade within a volatility band of $14.52 to $15.94. There remains a high probability for further upside, while a downward move appears less likely in current conditions. The baseline expectation is for the price to consolidate within the forecasted range; a bullish breakout could be triggered if LINK surpasses $15.94, while a break below immediate support near $14.25 would open the way for further declines.
Previously it was reported that Chainlink's CCIP 2.0 upgrade introduced customizable security layers for cross-chain transfers, addressing industry concerns over vulnerabilities in digital asset bridges. Current trading conditions suggest that the key level for LINK is a breakout above $15.94, which could signal further upside momentum in the near term.











-
 Afghanistan
-
 Albania
-
 Algeria
-
 Angola
-
 Argentina
-
 Armenia
-
 Australia
-
 Austria
-
 Azerbaijan
-
 Bahamas
-
 Bahrain
-
 Bangladesh
-
 Belarus
-
 Belgium
-
 Bolivia
-
 Botswana
-
 Brazil
-
 Brunei
-
 Bulgaria
-
 Cambodia
-
 Cameroon
-
 Canada
-
 Chile
-
 China
-
 Colombia
-
 Congo
-
 Costa Rica
-
 Cote d'Ivoire
-
 Croatia
-
 Cuba
-
 Cyprus
-
 Czechia
-
 DR Congo
-
 Denmark
-
 Dominican Republic
-
 Ecuador
-
 Egypt
-
 El Salvador
-
 Estonia
-
 Eswatini
-
 Ethiopia
-
 Finland
-
 France
-
 Georgia
-
 Germany
-
 Ghana
-
 Greece
-
 Haiti
-
 Hong Kong
-
 Hungary
-
 India
-
 Indonesia
-
 Iran, Islamic republic
-
 Iraq
-
 Ireland
-
 Israel
-
 Italy
-
 Jamaica
-
 Japan
-
 Jordan
-
 Kazakhstan
-
 Kenya
-
 Korea
-
 Kuwait
-
 Kyrgyzstan
-
 Laos
-
 Latvia
-
 Lebanon
-
 Lesotho
-
 Libya
-
 Lithuania
-
 Luxembourg
-
 Madagascar
-
 Malaysia
-
 Malta
-
 Mauritius
-
 Mexico
-
 Moldova
-
 Mongolia
-
 Montenegro
-
 Morocco
-
 Mozambique
-
 Myanmar
-
 Namibia
-
 Nepal
-
 Netherlands
-
 New Zealand
-
 Nigeria
-
 North Macedonia
-
 Norway
-
 Oman
-
 Pakistan
-
 Palestine
-
 Panama
-
 Papua New Guinea
-
 Paraguay
-
 Peru
-
 Philippines
-
 Poland
-
 Portugal
-
 Puerto Rico
-
 Qatar
-
 Reunion
-
 Romania
-
 Rwanda
-
 Saudi Arabia
-
 Serbia
-
 Singapore
-
 Slovakia
-
 Slovenia
-
 Somalia
-
 South Africa
-
 Spain
-
 Sri Lanka
-
 Sweden
-
 Switzerland
-
 Syria
-
 Taiwan
-
 Tajikistan
-
 Tanzania
-
 Thailand
-
 Trinidad and Tobago
-
 Tunisia
-
 Turkey
-
 UAE
-
 Uganda
-
 Ukraine
-
 United Kingdom
-
United States
-
 Uruguay
-
 Uzbekistan
-
 Venezuela
-
 Vietnam
-
 Yemen
-
 Zambia
-
 Zimbabwe
- Forex
- Crypto












