

Why is Aave falling today? Sellers drive losses; key support levels to watch

Aave (AAVE) is trading at $161.01 after a 7.26% decline today, having opened with a notable gap down and ending near the session low. The asset is currently below its key short-term averages and remains above longer-term trend markers.
 110.82
115.55
Highlights
- Aave introduced an on-chain buyback system purchasing about 292 AAVE daily from protocol revenue, strengthening buy-side token pressure.
- A potential supply reduction through a token burn mechanism is under evaluation, and Version 4 now allows tokenized stocks as collateral for USDC loans.
- AAVE trades under short-term selling pressure, with expected range of $151.76 to $170.26 for the next 2 to 3 days and technicals suggesting possible oversold bounce.
Buyback and burn plans as protocol enhancements meet selling pressure
Aave implemented the Aavenomics 3.0 update on June 27, 2026, introducing an automated, on-chain buyback mechanism that purchases around 292 AAVE tokens daily from protocol revenue, according to Cryptobriefing. This initiative creates ongoing buy-side pressure and directly reduces token float, which can help support baseline liquidity. Additionally, the team stated on September 29, 2026 that they are evaluating a potential token burn mechanism as part of the same update, which would alter how value is returned to holders via supply reduction. The recent launch of Version 4 on Base, enabling the use of tokenized stocks as collateral for USDC loans (Chaincatcher), further expands the platform’s functionality, though price action has remained under broader selling pressure.
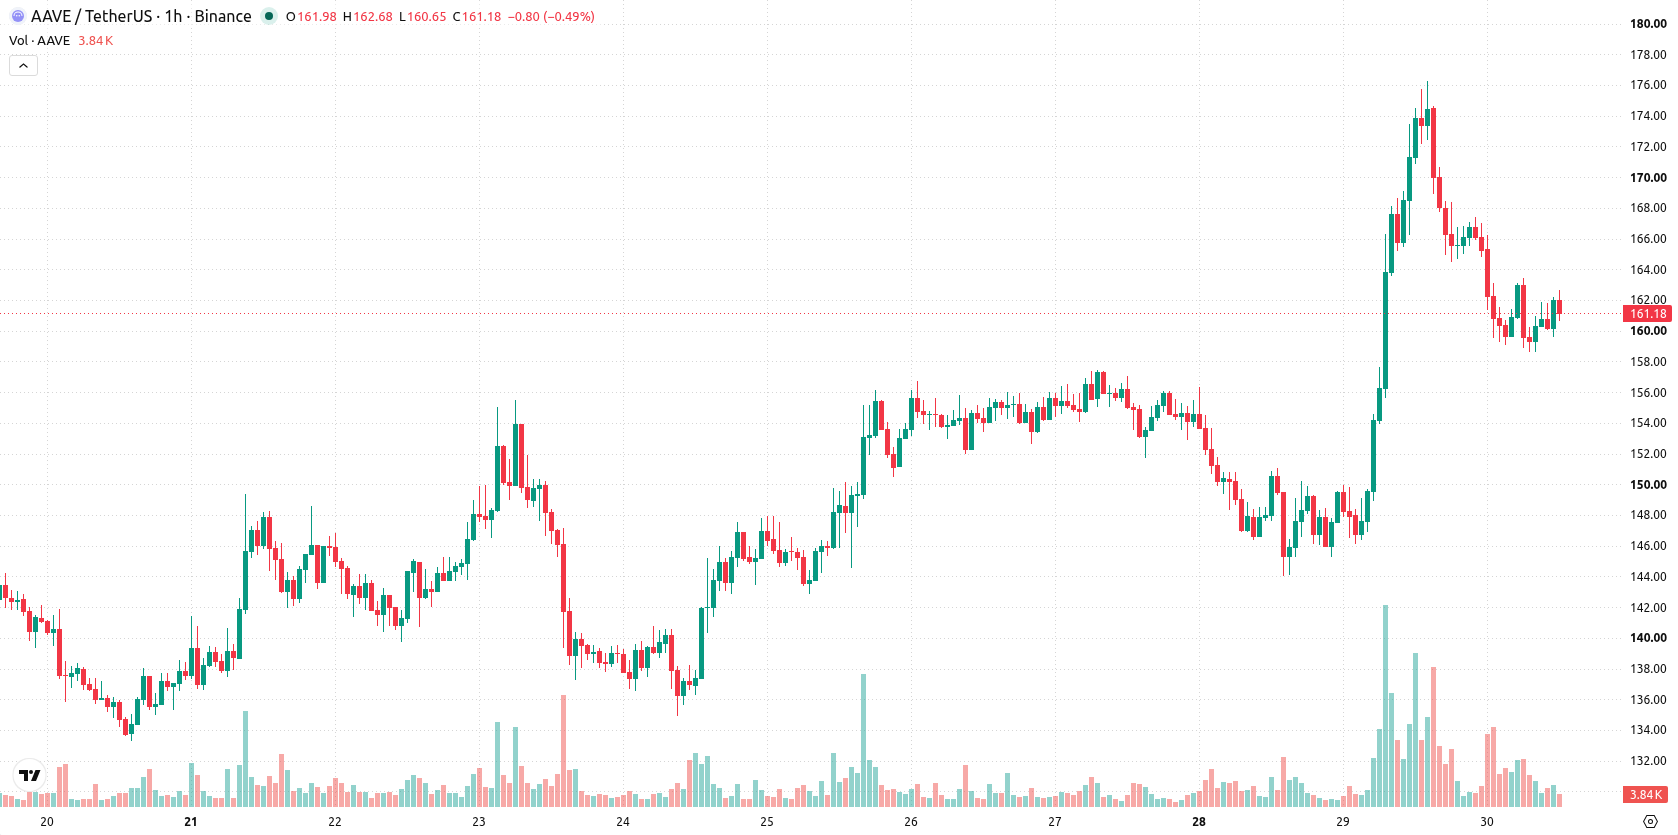
Downward momentum persists as short-term support tests intensify
Technically, AAVE is trading below the MA-20 ($162.84) but above the MA-50 ($158.12) on the hourly chart and remains well above the MA-200 ($99.57) on the daily timeframe. The immediate resistance is highlighted by the Ichimoku Kijun at $167.43, while downside support sits near $151.76. RSI is soft at 45.78 and CCI also signals sell, with Stoch RSI in oversold territory—indicating persistent downward momentum but some risk of a technical bounce. Both MACD and ADX remain neutral, and Bull/Bear Power is oversold, confirming strong seller dominance; the Awesome Oscillator also aligns with the negative intraday trend.
Recovery hinges on resistance break amid high volatility
Over the next two to three trading days, AAVE’s expected range is between $151.76 and $170.26, which reflects the recent volatility band. There is a 76% probability assigned to a short-term move higher, while the chance of continued downside is seen at 24%. A sustained recovery would require a daily close above the $167.43 resistance, whereas a break below $151.76 opens the path for further declines. If neither outcome occurs, the price may consolidate within the defined corridor amid ongoing volatility.
Earlier, analysts noted that Aave’s integration of tokenized stock collateral and technical enhancements had driven a period of sustained bullish momentum for the protocol. While current price action reflects increased volatility and near-term pressure, traders should monitor the $167.43 resistance and $151.76 support as pivotal levels for directional confirmation in the sessions ahead.











-
 Afghanistan
-
 Albania
-
 Algeria
-
 Angola
-
 Argentina
-
 Armenia
-
 Australia
-
 Austria
-
 Azerbaijan
-
 Bahamas
-
 Bahrain
-
 Bangladesh
-
 Belarus
-
 Belgium
-
 Bolivia
-
 Botswana
-
 Brazil
-
 Brunei
-
 Bulgaria
-
 Cambodia
-
 Cameroon
-
 Canada
-
 Chile
-
 China
-
 Colombia
-
 Congo
-
 Costa Rica
-
 Cote d'Ivoire
-
 Croatia
-
 Cuba
-
 Cyprus
-
 Czechia
-
 DR Congo
-
 Denmark
-
 Dominican Republic
-
 Ecuador
-
 Egypt
-
 El Salvador
-
 Estonia
-
 Eswatini
-
 Ethiopia
-
 Finland
-
 France
-
 Georgia
-
 Germany
-
 Ghana
-
 Greece
-
 Haiti
-
 Hong Kong
-
 Hungary
-
 India
-
 Indonesia
-
 Iran, Islamic republic
-
 Iraq
-
 Ireland
-
 Israel
-
 Italy
-
 Jamaica
-
 Japan
-
 Jordan
-
 Kazakhstan
-
 Kenya
-
 Korea
-
 Kuwait
-
 Kyrgyzstan
-
 Laos
-
 Latvia
-
 Lebanon
-
 Lesotho
-
 Libya
-
 Lithuania
-
 Luxembourg
-
 Madagascar
-
 Malaysia
-
 Malta
-
 Mauritius
-
 Mexico
-
 Moldova
-
 Mongolia
-
 Montenegro
-
 Morocco
-
 Mozambique
-
 Myanmar
-
 Namibia
-
 Nepal
-
 Netherlands
-
 New Zealand
-
 Nigeria
-
 North Macedonia
-
 Norway
-
 Oman
-
 Pakistan
-
 Palestine
-
 Panama
-
 Papua New Guinea
-
 Paraguay
-
 Peru
-
 Philippines
-
 Poland
-
 Portugal
-
 Puerto Rico
-
 Qatar
-
 Reunion
-
 Romania
-
 Rwanda
-
 Saudi Arabia
-
 Serbia
-
 Singapore
-
 Slovakia
-
 Slovenia
-
 Somalia
-
 South Africa
-
 Spain
-
 Sri Lanka
-
 Sweden
-
 Switzerland
-
 Syria
-
 Taiwan
-
 Tajikistan
-
 Tanzania
-
 Thailand
-
 Trinidad and Tobago
-
 Tunisia
-
 Turkey
-
 UAE
-
 Uganda
-
 Ukraine
-
 United Kingdom
-
United States
-
 Uruguay
-
 Uzbekistan
-
 Venezuela
-
 Vietnam
-
 Yemen
-
 Zambia
-
 Zimbabwe
- Forex
- Crypto












