

Cosmos weekly outlook: Can ATOM find a floor as Stochastic RSI signals oversold conditions?

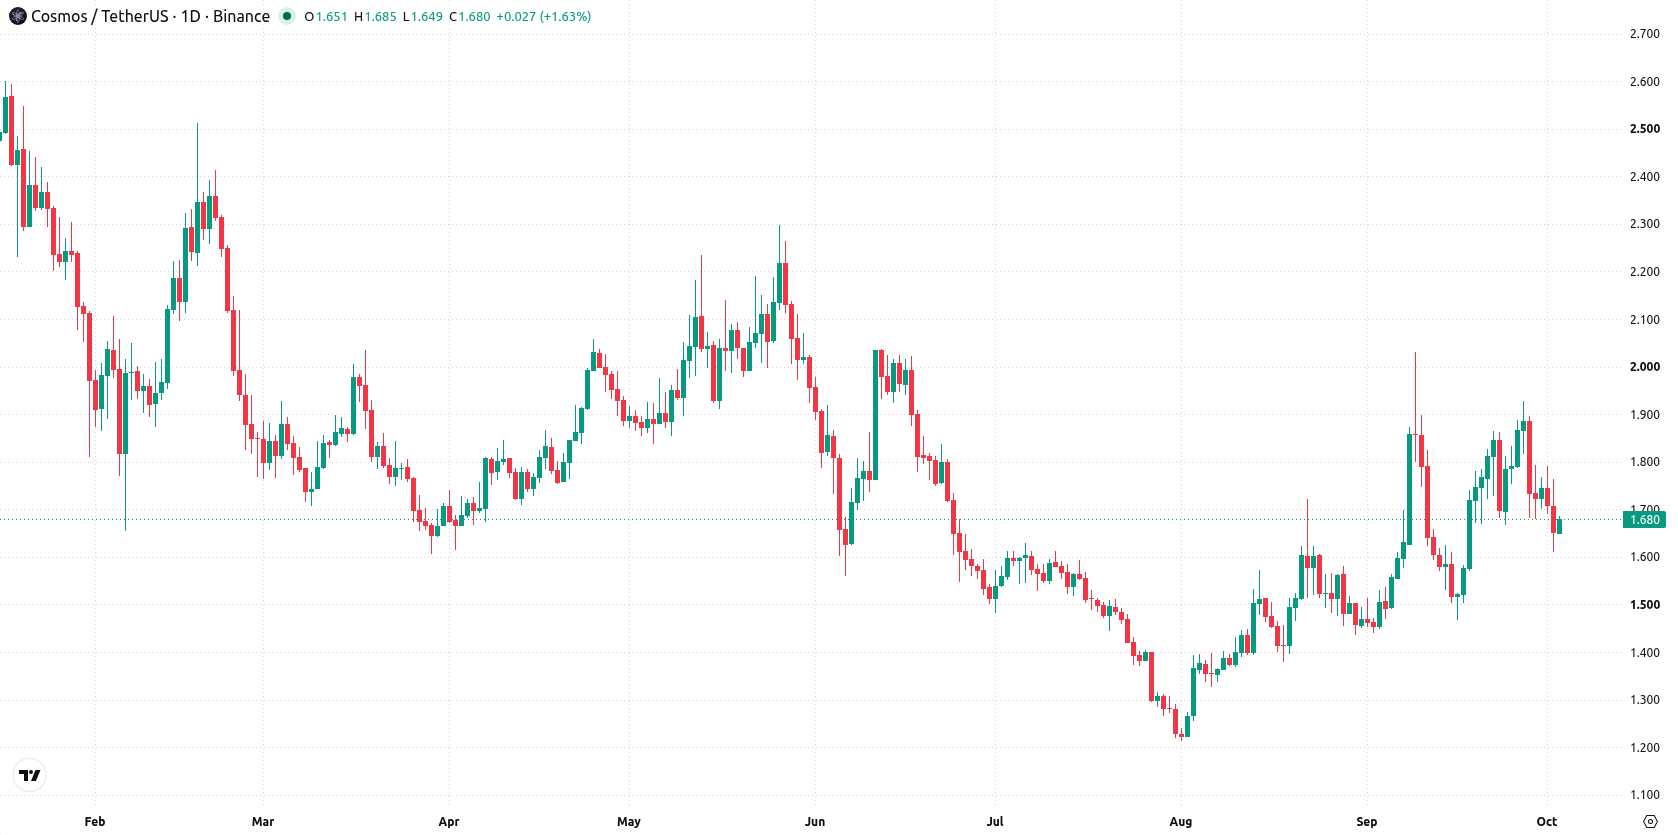
Cosmos (ATOM) enters the week near $1.68 after a nearly 7% slide, as regulatory scrutiny intensifies across the crypto sector. With sellers maintaining firm control and the setup persistently oversold, market sentiment hinges on how swiftly governance uncertainties are resolved in the days ahead.
 1.439
1.6540000
Highlights
- Cosmos trades at $1.678, down 7.45% over the past 7 days, and sits below key short-term moving averages.
- Mixed technical indicator signals show strong trend pressure and oversold conditions, with support at $1.61592 and resistance near $1.70595 to $1.7495.
- Price is expected to fluctuate in a $1.5102593 to $1.8457406 range over the next 7 days with no directional bias.
Governance exploit response shapes sentiment as recovery plan unfolds
According to CryptoSlate and TokenPost, Cosmos Hub validators responded to a governance exploit on the Neutron network by intercepting roughly 1.23 million stolen ATOM tokens on September 22, 2026. While an emergency software patch secured the funds and moved them to a recovery multisig, refunds remain on hold subject to a Cosmos Hub governance vote and a pending Neutron recovery plan. The asset's outlook is shaped by how these ongoing governance deliberations impact user confidence and potential supply flows this week.
Firm downtrend persists as technical signals flag oversold risks
The daily chart shows a sustained move lower with a firm trend, as highlighted by the 19.69% volatility over the week. While MACD maintains a "Strong Buy" stance at 0.0312158, momentum signals are mixed: Stochastic RSI sits firmly in the oversold zone, indicating potential exhaustion, while ADX points to continued trend strength. Support is found at $1.61592 (MA-50), while the MA-200 at $1.70595 forms near resistance, accompanied by the Ichimoku Kijun at $1.7495 acting as an additional barrier. This structure favors caution near resistance levels and vigilance for possible upside reversals from oversold conditions.
Balanced breakout risk as price confined within established range next week
Over the next 7 days, Cosmos is expected to trade between $1.5102593 and $1.8457406, with probabilities balanced at 50% for either direction. The base case is for price action to oscillate within this band, with $1.70595 and $1.7495 capping potential rallies and $1.61592 acting as support. A sustained move above resistance would shift focus to the upper end of the expected range, while a break below support would open downside toward $1.5102593.
Earlier, analysts noted that Cosmos faced persistent technical and security challenges following a major protocol exploit, with downside risks highlighted in its overall setup. The latest price action reinforces this cautious outlook, as the asset remains highly volatile within a $1.5102593–$1.8457406 trading range, making key levels at $1.61592 and $1.7495 crucial markers for potential trend shifts in the coming days.










-
 Afghanistan
-
 Albania
-
 Algeria
-
 Angola
-
 Argentina
-
 Armenia
-
 Australia
-
 Austria
-
 Azerbaijan
-
 Bahamas
-
 Bahrain
-
 Bangladesh
-
 Belarus
-
 Belgium
-
 Bolivia
-
 Botswana
-
 Brazil
-
 Brunei
-
 Bulgaria
-
 Cambodia
-
 Cameroon
-
 Canada
-
 Chile
-
 China
-
 Colombia
-
 Congo
-
 Costa Rica
-
 Cote d'Ivoire
-
 Croatia
-
 Cuba
-
 Cyprus
-
 Czechia
-
 DR Congo
-
 Denmark
-
 Dominican Republic
-
 Ecuador
-
 Egypt
-
 El Salvador
-
 Estonia
-
 Eswatini
-
 Ethiopia
-
 Finland
-
 France
-
 Georgia
-
 Germany
-
 Ghana
-
 Greece
-
 Haiti
-
 Hong Kong
-
 Hungary
-
 India
-
 Indonesia
-
 Iran, Islamic republic
-
 Iraq
-
 Ireland
-
 Israel
-
 Italy
-
 Jamaica
-
 Japan
-
 Jordan
-
 Kazakhstan
-
 Kenya
-
 Korea
-
 Kuwait
-
 Kyrgyzstan
-
 Laos
-
 Latvia
-
 Lebanon
-
 Lesotho
-
 Libya
-
 Lithuania
-
 Luxembourg
-
 Madagascar
-
 Malaysia
-
 Malta
-
 Mauritius
-
 Mexico
-
 Moldova
-
 Mongolia
-
 Montenegro
-
 Morocco
-
 Mozambique
-
 Myanmar
-
 Namibia
-
 Nepal
-
 Netherlands
-
 New Zealand
-
 Nigeria
-
 North Macedonia
-
 Norway
-
 Oman
-
 Pakistan
-
 Palestine
-
 Panama
-
 Papua New Guinea
-
 Paraguay
-
 Peru
-
 Philippines
-
 Poland
-
 Portugal
-
 Puerto Rico
-
 Qatar
-
 Reunion
-
 Romania
-
 Rwanda
-
 Saudi Arabia
-
 Serbia
-
 Singapore
-
 Slovakia
-
 Slovenia
-
 Somalia
-
 South Africa
-
 Spain
-
 Sri Lanka
-
 Sweden
-
 Switzerland
-
 Syria
-
 Taiwan
-
 Tajikistan
-
 Tanzania
-
 Thailand
-
 Trinidad and Tobago
-
 Tunisia
-
 Turkey
-
 UAE
-
 Uganda
-
 Ukraine
-
 United Kingdom
-
United States
-
 Uruguay
-
 Uzbekistan
-
 Venezuela
-
 Vietnam
-
 Yemen
-
 Zambia
-
 Zimbabwe
- Forex
- Crypto












