

What's behind Sandbox's latest 12.1% price pullback?

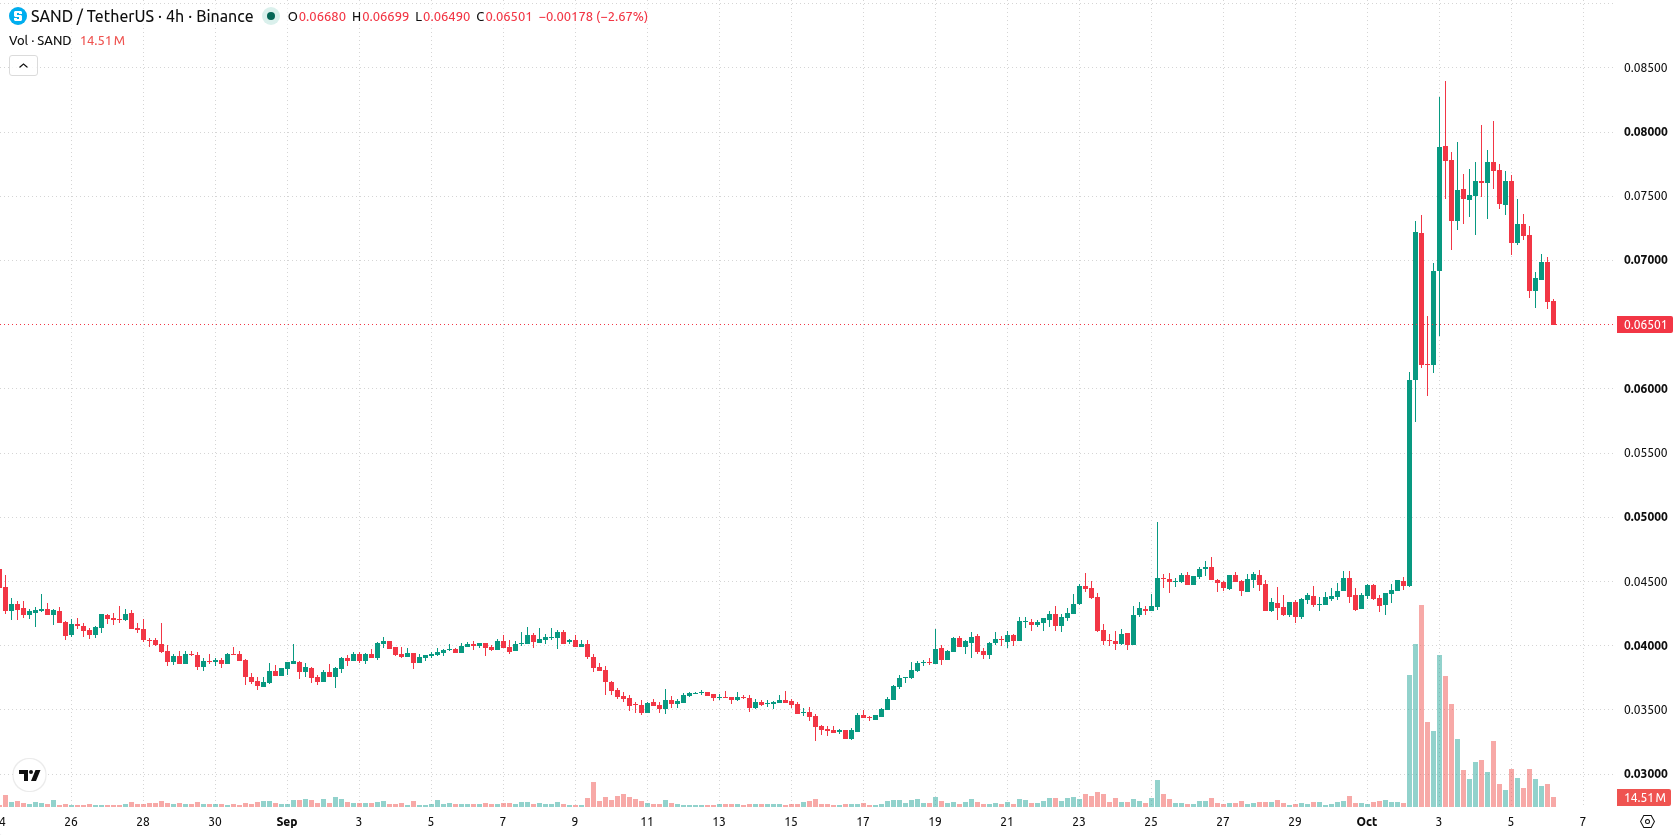
Sandbox (SAND) dropped 12.09% on the day as broad selling pressure triggered a strong downside move. The decline is supported by a technical structure where the asset, despite trading above major moving averages, faces overbought risk and intraday volatility amid mixed oscillator signals.
 0.0363
0.0434
Highlights
- SAND/USD trades above all major moving averages, with short, medium, and long-term signals pointing bullish.
- Momentum indicators such as MACD and ADX show buying pressure, but RSI and CCI indicate overbought conditions, while Stochastic RSI signals strong sell.
- The five-day expected price range is $0.052 to $0.1049, with a 79% probability of an upward move and sideways trading near current levels as baseline.
Bullish near-term signals offset by long-term structural caution
SAND/USD is trading above all major moving averages, with the current price at $0.065 positioned over the MA-20 ($0.048), MA-50 ($0.043), and MA-200 ($0.057). This signals a bullish underlying stance in the short, medium, and long term, reinforced by the Ichimoku Kijun at $0.0582 as a near-term support and the ceiling at $0.0672. However, the longer-term MA-50 versus MA-200 configuration remains bearish, suggesting structural caution. Momentum signals are positive, with MACD and ADX forecasting a "Buy", while RSI at 71.992 and CCI at 163.6455 indicate overbought territory. Stochastic RSI issues a "Strong Sell" counter-signal, and Bull/Bear Power is positive at 0.0203, with the Awesome Oscillator also backing recent gains. SAND/USD is down $0.0089 on the day, trading near daily lows with increased volatility and mixed oscillator signals highlighting underlying uncertainty following the downside gap.
Earlier, analysts noted that Sandbox (SAND) was at risk of a near-term correction as overbought technical indicators clashed with ongoing bullish momentum. The current analysis adds weight to that view by highlighting elevated volatility and mixed signals, with the $0.0582 support level now critical for assessing further downside risk.









-
 Afghanistan
-
 Albania
-
 Algeria
-
 Angola
-
 Argentina
-
 Armenia
-
 Australia
-
 Austria
-
 Azerbaijan
-
 Bahamas
-
 Bahrain
-
 Bangladesh
-
 Belarus
-
 Belgium
-
 Bolivia
-
 Botswana
-
 Brazil
-
 Brunei
-
 Bulgaria
-
 Cambodia
-
 Cameroon
-
 Canada
-
 Chile
-
 China
-
 Colombia
-
 Congo
-
 Costa Rica
-
 Cote d'Ivoire
-
 Croatia
-
 Cuba
-
 Cyprus
-
 Czechia
-
 DR Congo
-
 Denmark
-
 Dominican Republic
-
 Ecuador
-
 Egypt
-
 El Salvador
-
 Estonia
-
 Eswatini
-
 Ethiopia
-
 Finland
-
 France
-
 Georgia
-
 Germany
-
 Ghana
-
 Greece
-
 Haiti
-
 Hong Kong
-
 Hungary
-
 India
-
 Indonesia
-
 Iran, Islamic republic
-
 Iraq
-
 Ireland
-
 Israel
-
 Italy
-
 Jamaica
-
 Japan
-
 Jordan
-
 Kazakhstan
-
 Kenya
-
 Korea
-
 Kuwait
-
 Kyrgyzstan
-
 Laos
-
 Latvia
-
 Lebanon
-
 Lesotho
-
 Libya
-
 Lithuania
-
 Luxembourg
-
 Madagascar
-
 Malaysia
-
 Malta
-
 Mauritius
-
 Mexico
-
 Moldova
-
 Mongolia
-
 Montenegro
-
 Morocco
-
 Mozambique
-
 Myanmar
-
 Namibia
-
 Nepal
-
 Netherlands
-
 New Zealand
-
 Nigeria
-
 North Macedonia
-
 Norway
-
 Oman
-
 Pakistan
-
 Palestine
-
 Panama
-
 Papua New Guinea
-
 Paraguay
-
 Peru
-
 Philippines
-
 Poland
-
 Portugal
-
 Puerto Rico
-
 Qatar
-
 Reunion
-
 Romania
-
 Rwanda
-
 Saudi Arabia
-
 Serbia
-
 Singapore
-
 Slovakia
-
 Slovenia
-
 Somalia
-
 South Africa
-
 Spain
-
 Sri Lanka
-
 Sweden
-
 Switzerland
-
 Syria
-
 Taiwan
-
 Tajikistan
-
 Tanzania
-
 Thailand
-
 Trinidad and Tobago
-
 Tunisia
-
 Turkey
-
 UAE
-
 Uganda
-
 Ukraine
-
 United Kingdom
-
United States
-
 Uruguay
-
 Uzbekistan
-
 Venezuela
-
 Vietnam
-
 Yemen
-
 Zambia
-
 Zimbabwe
- Forex
- Crypto












