

What's behind Sonic's latest 11.0% price pullback?

Sonic (S, formerly Fantom) tumbled 11.01% as selling pressure intensified in the absence of fresh news catalysts. The decline is underscored by price action slipping back toward the 20-day moving average, suggesting underlying buyers may be pulling back even as key technical signals hold broadly bullish momentum.
 0.0344
0.0393
Highlights
- S/USD trades above key moving averages, indicating upward bias in short-, medium-, and long-term trends despite recent declines.
- Momentum indicators are mostly bullish but overbought signals and intraday selling pressure suggest caution near current levels.
- The expected price range for the next five sessions is $0.0352 to $0.0436, with a very high probability of an upward move.
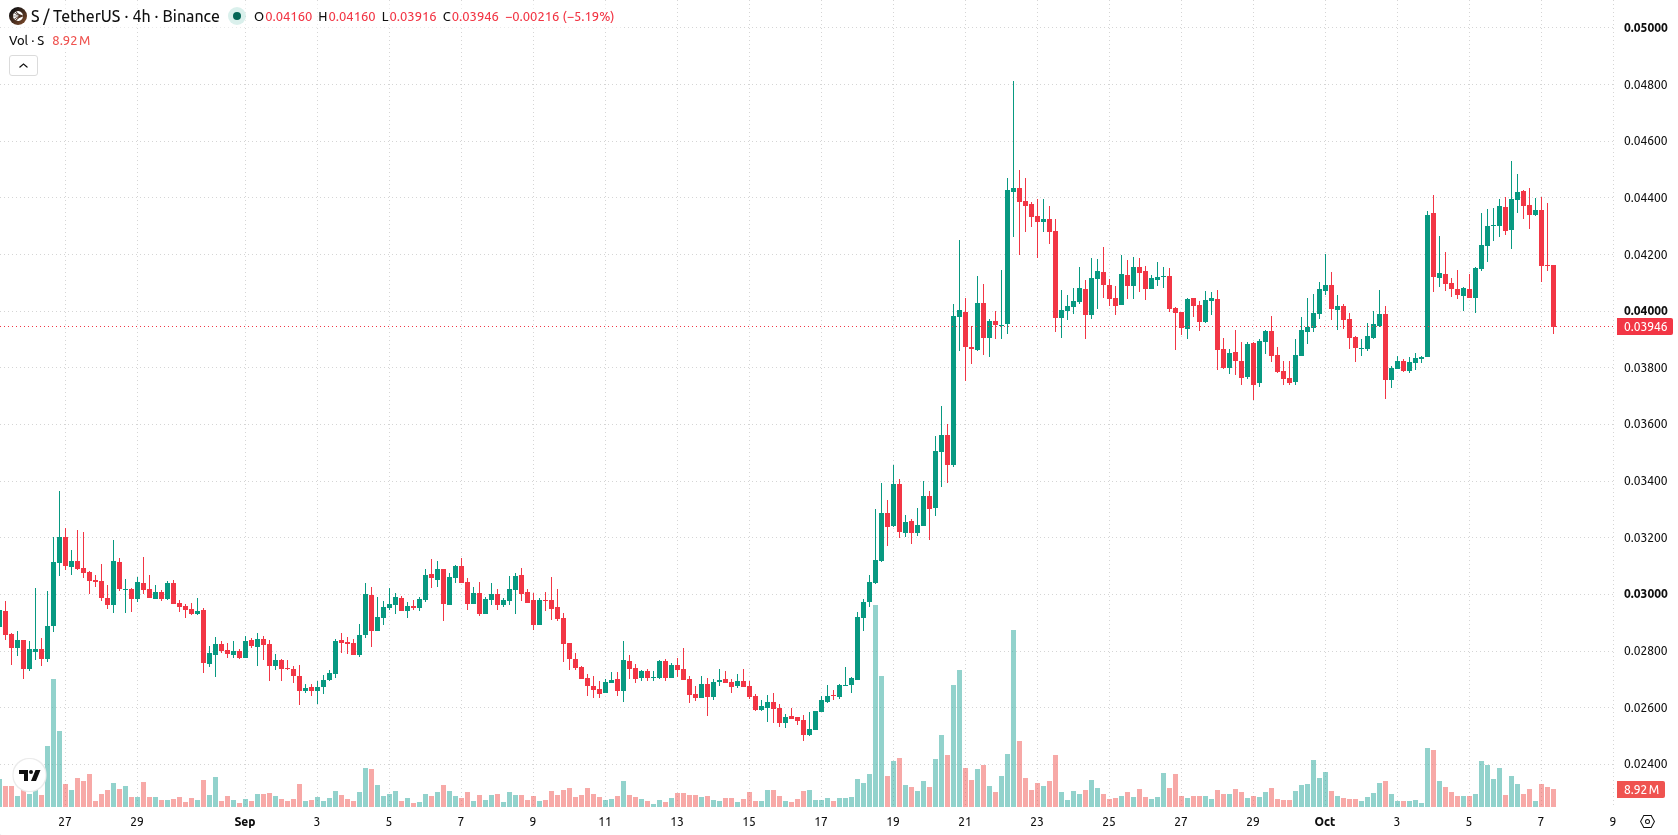
Mixed technical signals as short-term momentum battles long-term pressure
S/USD is currently trading above its 20-day moving average at $0.0392, the 50-day at $0.0323, and the 200-day at $0.0341, indicating that short-, medium-, and long-term trends are biased to the upside. The near-term ceiling is set at $0.041, while immediate support is defined by the 20-day moving average at $0.0392. The 50-day versus 200-day moving average alignment remains bearish, signaling long-term overhead pressure despite recent gains. Momentum indicators show Relative Strength Index (RSI) at 62.06 with a buy signal, with MACD and Average Directional Index (ADX) both confirming bullish momentum. The Commodity Channel Index (CCI) reads 108.71, indicating overbought conditions, and Stochastic RSI sits at 40.07, remaining neutral. Bull/Bear Power (BBP) at 0.005 shows intraday buying dominance, and the Awesome Oscillator (AO) also points upward. Today, the pair is trading near the intraday low, posting an 11.01% decline after a downside gap of around 1.58%. Intraday volatility stands at 7.32%. Most momentum signals remain positive except for the HMA, which signals a sell.
Earlier, analysts noted that Sonic had shifted from a bullish technical outlook to heightened downside risk amid intensifying selling pressure and deteriorating momentum signals. With current data indicating mostly bullish momentum despite a sharp intraday drop, traders should monitor the 20-day moving average at $0.0392 as the key pivot for potential breakouts or further declines in the coming sessions.










-
 Afghanistan
-
 Albania
-
 Algeria
-
 Angola
-
 Argentina
-
 Armenia
-
 Australia
-
 Austria
-
 Azerbaijan
-
 Bahamas
-
 Bahrain
-
 Bangladesh
-
 Belarus
-
 Belgium
-
 Bolivia
-
 Botswana
-
 Brazil
-
 Brunei
-
 Bulgaria
-
 Cambodia
-
 Cameroon
-
 Canada
-
 Chile
-
 China
-
 Colombia
-
 Congo
-
 Costa Rica
-
 Cote d'Ivoire
-
 Croatia
-
 Cuba
-
 Cyprus
-
 Czechia
-
 DR Congo
-
 Denmark
-
 Dominican Republic
-
 Ecuador
-
 Egypt
-
 El Salvador
-
 Estonia
-
 Eswatini
-
 Ethiopia
-
 Finland
-
 France
-
 Georgia
-
 Germany
-
 Ghana
-
 Greece
-
 Haiti
-
 Hong Kong
-
 Hungary
-
 India
-
 Indonesia
-
 Iran, Islamic republic
-
 Iraq
-
 Ireland
-
 Israel
-
 Italy
-
 Jamaica
-
 Japan
-
 Jordan
-
 Kazakhstan
-
 Kenya
-
 Korea
-
 Kuwait
-
 Kyrgyzstan
-
 Laos
-
 Latvia
-
 Lebanon
-
 Lesotho
-
 Libya
-
 Lithuania
-
 Luxembourg
-
 Madagascar
-
 Malaysia
-
 Malta
-
 Mauritius
-
 Mexico
-
 Moldova
-
 Mongolia
-
 Montenegro
-
 Morocco
-
 Mozambique
-
 Myanmar
-
 Namibia
-
 Nepal
-
 Netherlands
-
 New Zealand
-
 Nigeria
-
 North Macedonia
-
 Norway
-
 Oman
-
 Pakistan
-
 Palestine
-
 Panama
-
 Papua New Guinea
-
 Paraguay
-
 Peru
-
 Philippines
-
 Poland
-
 Portugal
-
 Puerto Rico
-
 Qatar
-
 Reunion
-
 Romania
-
 Rwanda
-
 Saudi Arabia
-
 Serbia
-
 Singapore
-
 Slovakia
-
 Slovenia
-
 Somalia
-
 South Africa
-
 Spain
-
 Sri Lanka
-
 Sweden
-
 Switzerland
-
 Syria
-
 Taiwan
-
 Tajikistan
-
 Tanzania
-
 Thailand
-
 Trinidad and Tobago
-
 Tunisia
-
 Turkey
-
 UAE
-
 Uganda
-
 Ukraine
-
 United Kingdom
-
United States
-
 Uruguay
-
 Uzbekistan
-
 Venezuela
-
 Vietnam
-
 Yemen
-
 Zambia
-
 Zimbabwe
- Forex
- Crypto












