


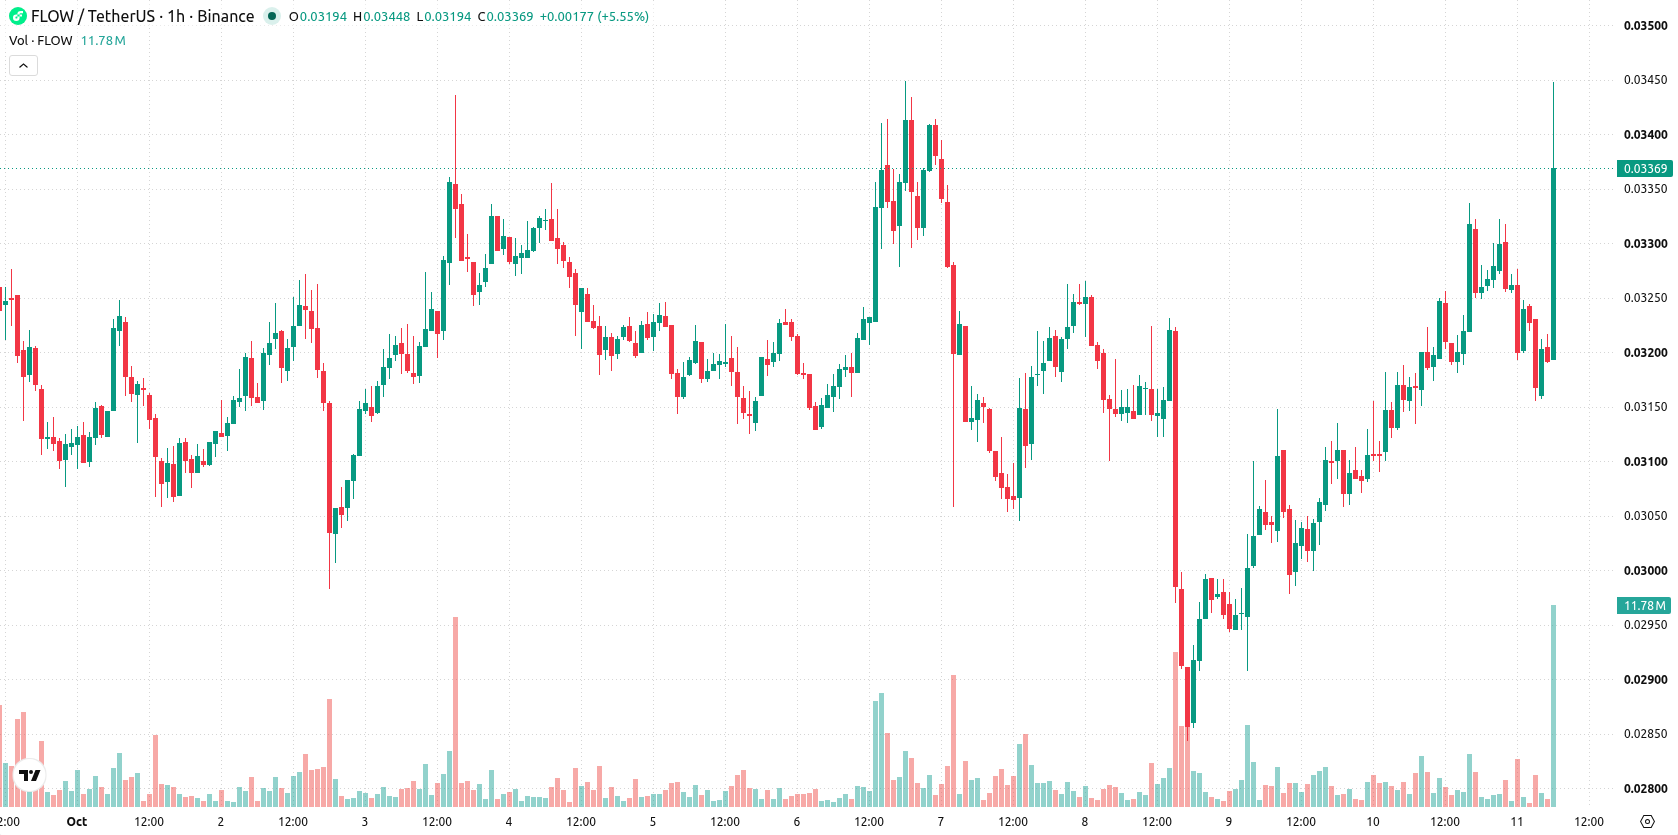
Flow (FLOW) is trading at $0.0343, recording a daily gain of 8.75%. The price is currently positioned above its key moving averages, signaling continued strength in the short, medium, and long-term timeframes.
 0.0175
0.0210
Highlights
- FLOW/USD holds above short-, medium-, and long-term moving averages, confirming strong bullish momentum across timeframes.
- Technical indicators show a mixed setup, with trend momentum strong but several oscillators neutral or showing limited sell-side pressure.
- For the next 2 to 3 days, FLOW/USD is projected to range from $0.031 to $0.0357, with a 60% probability of further upside.
Bullish momentum faces caution as oscillators signal mixed sentiment
On the technical front, FLOW continues to hold above the MA-20 ($0.0324) and MA-50 ($0.0315) on the hourly chart, while also maintaining levels above the MA-200 ($0.031) on the daily timeframe. Immediate support is marked by the Ichimoku Kijun at $0.0323. MACD signals Strong Buy and ADX points to elevated bullish activity, suggesting ongoing positive momentum. However, RSI at 50.6 and Stoch RSI both remain neutral, with CCI and Bull/Bear Power highlighting some sell-side pressure. The Awesome Oscillator is neutral, and the combination of bullish momentum readings and mixed oscillator signals highlights underlying caution despite the recent advance.
Sideways consolidation expected as volatility and breakout risks build
Over the next 2–3 trading days, FLOW/USD is expected to fluctuate within a range of $0.031 to $0.0357, reflecting typical volatility for the asset. There is a 60% probability of further upside, while a downward move appears less likely in the immediate term. Baseline scenario anticipates sideways consolidation. A clear breakout above $0.0357 could drive a bullish continuation higher, whereas a fall below support at $0.031 may prompt a steeper decline.
Earlier, analysts noted that Flow was positioned at a technical inflection point, with the potential for a sustained breakout contingent on continued momentum. The latest price action reinforces this outlook, putting special emphasis on the $0.0357 resistance as the critical level to monitor for a decisive move in the coming sessions.






Latest FLOW News




-
 Afghanistan
-
 Albania
-
 Algeria
-
 Angola
-
 Argentina
-
 Armenia
-
 Australia
-
 Austria
-
 Azerbaijan
-
 Bahamas
-
 Bahrain
-
 Bangladesh
-
 Belarus
-
 Belgium
-
 Bolivia
-
 Botswana
-
 Brazil
-
 Brunei
-
 Bulgaria
-
 Cambodia
-
 Cameroon
-
 Canada
-
 Chile
-
 China
-
 Colombia
-
 Congo
-
 Costa Rica
-
 Cote d'Ivoire
-
 Croatia
-
 Cuba
-
 Cyprus
-
 Czechia
-
 DR Congo
-
 Denmark
-
 Dominican Republic
-
 Ecuador
-
 Egypt
-
 El Salvador
-
 Estonia
-
 Eswatini
-
 Ethiopia
-
 Finland
-
 France
-
 Georgia
-
 Germany
-
 Ghana
-
 Greece
-
 Haiti
-
 Hong Kong
-
 Hungary
-
 India
-
 Indonesia
-
 Iran, Islamic republic
-
 Iraq
-
 Ireland
-
 Israel
-
 Italy
-
 Jamaica
-
 Japan
-
 Jordan
-
 Kazakhstan
-
 Kenya
-
 Korea
-
 Kuwait
-
 Kyrgyzstan
-
 Laos
-
 Latvia
-
 Lebanon
-
 Lesotho
-
 Libya
-
 Lithuania
-
 Luxembourg
-
 Madagascar
-
 Malaysia
-
 Malta
-
 Mauritius
-
 Mexico
-
 Moldova
-
 Mongolia
-
 Montenegro
-
 Morocco
-
 Mozambique
-
 Myanmar
-
 Namibia
-
 Nepal
-
 Netherlands
-
 New Zealand
-
 Nigeria
-
 North Macedonia
-
 Norway
-
 Oman
-
 Pakistan
-
 Palestine
-
 Panama
-
 Papua New Guinea
-
 Paraguay
-
 Peru
-
 Philippines
-
 Poland
-
 Portugal
-
 Puerto Rico
-
 Qatar
-
 Reunion
-
 Romania
-
 Rwanda
-
 Saudi Arabia
-
 Serbia
-
 Singapore
-
 Slovakia
-
 Slovenia
-
 Somalia
-
 South Africa
-
 Spain
-
 Sri Lanka
-
 Sweden
-
 Switzerland
-
 Syria
-
 Taiwan
-
 Tajikistan
-
 Tanzania
-
 Thailand
-
 Trinidad and Tobago
-
 Tunisia
-
 Turkey
-
 UAE
-
 Uganda
-
 Ukraine
-
 United Kingdom
-
United States
-
 Uruguay
-
 Uzbekistan
-
 Venezuela
-
 Vietnam
-
 Yemen
-
 Zambia
-
 Zimbabwe
- Forex
- Crypto












