

Flow technical analysis: Rally challenges $0.0396 resistance

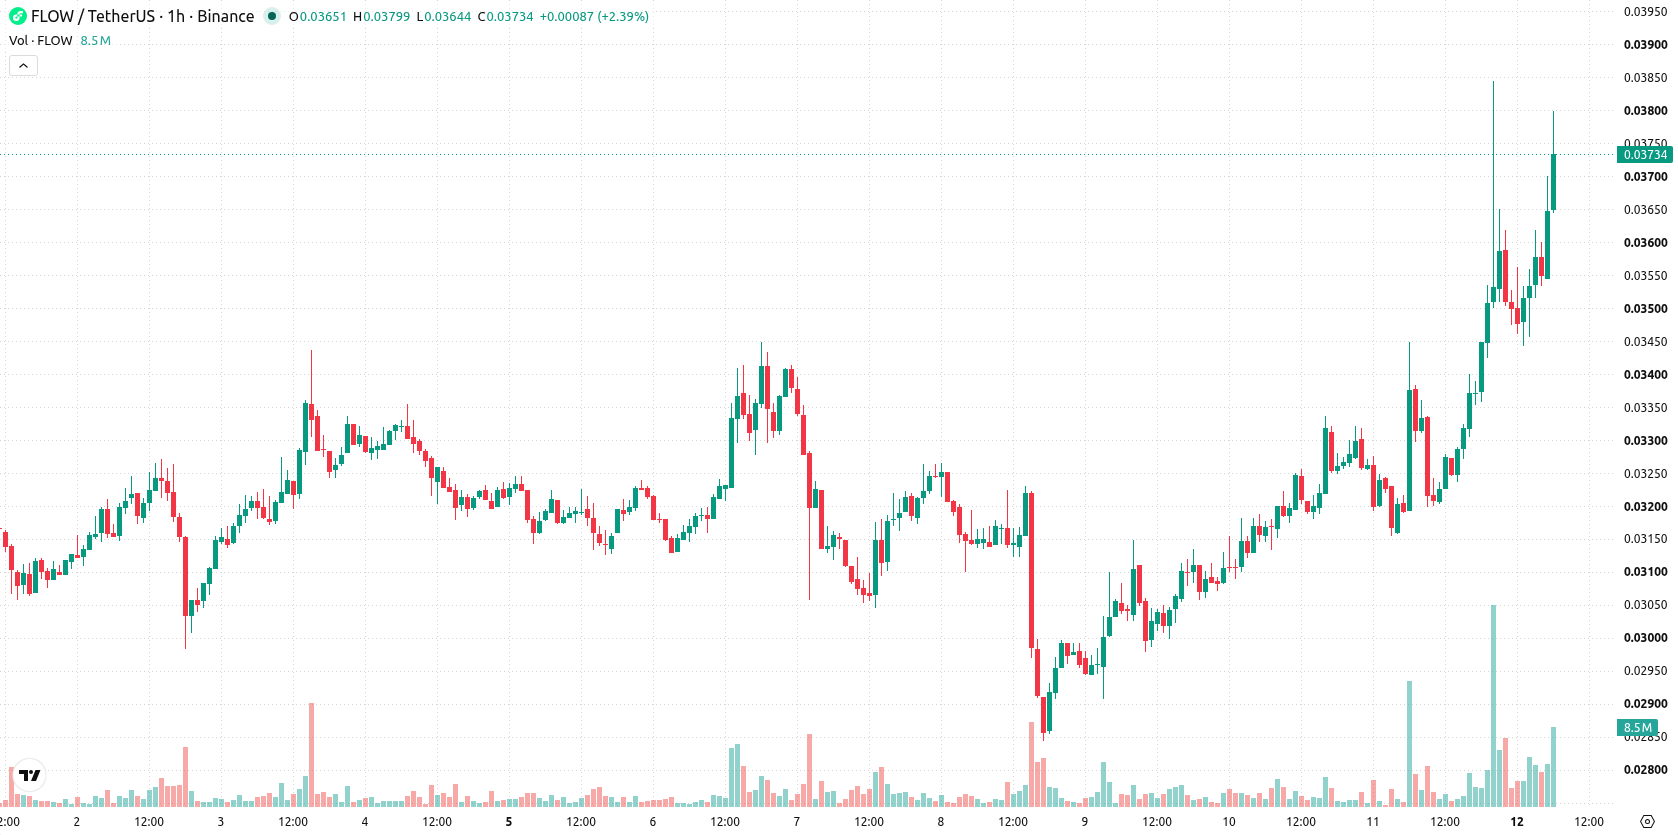
Flow (FLOW) is trading at $0.0373, showing a daily gain of 10.44%. The asset currently sits above its key moving averages, reflecting strong bullish momentum.
 0.0175
0.0210
Highlights
- FLOW/USD has risen 10.44% to $0.0373 today, trading above key moving average levels across timeframes.
- Technical momentum is positive, with multiple indicators confirming ongoing buyer strength and an absence of overbought conditions.
- Price is expected to consolidate in the $0.035 to $0.0396 range over the next 2 to 3 sessions, with immediate support at $0.035.
Technical strength confirmed as positive momentum aligns with support
On the technical front, FLOW remains above its MA-20 ($0.0343), MA-50 ($0.0331), and MA-200 ($0.0311) on the hourly chart, while the Ichimoku Kijun at $0.035 acts as immediate support. Momentum readings are positive: RSI stands at 66.36, CCI signals a Buy, MACD and ADX confirm ongoing bullish strength, and the Awesome Oscillator also supports the current uptrend. Stochastic RSI reads as Neutral, with Bull/Bear Power highlighting intraday buyer dominance.
High probability of gains as price eyes breakout scenario
Over the next 2-3 trading days, price is expected to consolidate within the $0.035–$0.0396 range. The probability of an up move is very high, while the chance of a down move is very low. If resistance is broken, the bullish scenario projects a move toward $0.0396. A bearish scenario may emerge only if FLOW falls below the $0.035 support set by the Ichimoku Kijun.
Earlier, analysts noted that Flow was demonstrating strengthening bullish momentum supported by positive technical signals. With new data confirming ongoing upside across multiple indicators, traders should closely monitor price action around the $0.035–$0.0396 consolidation zone for a potential breakout.






Latest FLOW News




-
 Afghanistan
-
 Albania
-
 Algeria
-
 Angola
-
 Argentina
-
 Armenia
-
 Australia
-
 Austria
-
 Azerbaijan
-
 Bahamas
-
 Bahrain
-
 Bangladesh
-
 Belarus
-
 Belgium
-
 Bolivia
-
 Botswana
-
 Brazil
-
 Brunei
-
 Bulgaria
-
 Cambodia
-
 Cameroon
-
 Canada
-
 Chile
-
 China
-
 Colombia
-
 Congo
-
 Costa Rica
-
 Cote d'Ivoire
-
 Croatia
-
 Cuba
-
 Cyprus
-
 Czechia
-
 DR Congo
-
 Denmark
-
 Dominican Republic
-
 Ecuador
-
 Egypt
-
 El Salvador
-
 Estonia
-
 Eswatini
-
 Ethiopia
-
 Finland
-
 France
-
 Georgia
-
 Germany
-
 Ghana
-
 Greece
-
 Haiti
-
 Hong Kong
-
 Hungary
-
 India
-
 Indonesia
-
 Iran, Islamic republic
-
 Iraq
-
 Ireland
-
 Israel
-
 Italy
-
 Jamaica
-
 Japan
-
 Jordan
-
 Kazakhstan
-
 Kenya
-
 Korea
-
 Kuwait
-
 Kyrgyzstan
-
 Laos
-
 Latvia
-
 Lebanon
-
 Lesotho
-
 Libya
-
 Lithuania
-
 Luxembourg
-
 Madagascar
-
 Malaysia
-
 Malta
-
 Mauritius
-
 Mexico
-
 Moldova
-
 Mongolia
-
 Montenegro
-
 Morocco
-
 Mozambique
-
 Myanmar
-
 Namibia
-
 Nepal
-
 Netherlands
-
 New Zealand
-
 Nigeria
-
 North Macedonia
-
 Norway
-
 Oman
-
 Pakistan
-
 Palestine
-
 Panama
-
 Papua New Guinea
-
 Paraguay
-
 Peru
-
 Philippines
-
 Poland
-
 Portugal
-
 Puerto Rico
-
 Qatar
-
 Reunion
-
 Romania
-
 Rwanda
-
 Saudi Arabia
-
 Serbia
-
 Singapore
-
 Slovakia
-
 Slovenia
-
 Somalia
-
 South Africa
-
 Spain
-
 Sri Lanka
-
 Sweden
-
 Switzerland
-
 Syria
-
 Taiwan
-
 Tajikistan
-
 Tanzania
-
 Thailand
-
 Trinidad and Tobago
-
 Tunisia
-
 Turkey
-
 UAE
-
 Uganda
-
 Ukraine
-
 United Kingdom
-
United States
-
 Uruguay
-
 Uzbekistan
-
 Venezuela
-
 Vietnam
-
 Yemen
-
 Zambia
-
 Zimbabwe
- Forex
- Crypto












