

Minor divergence signals momentum: Can Maple extend gains?

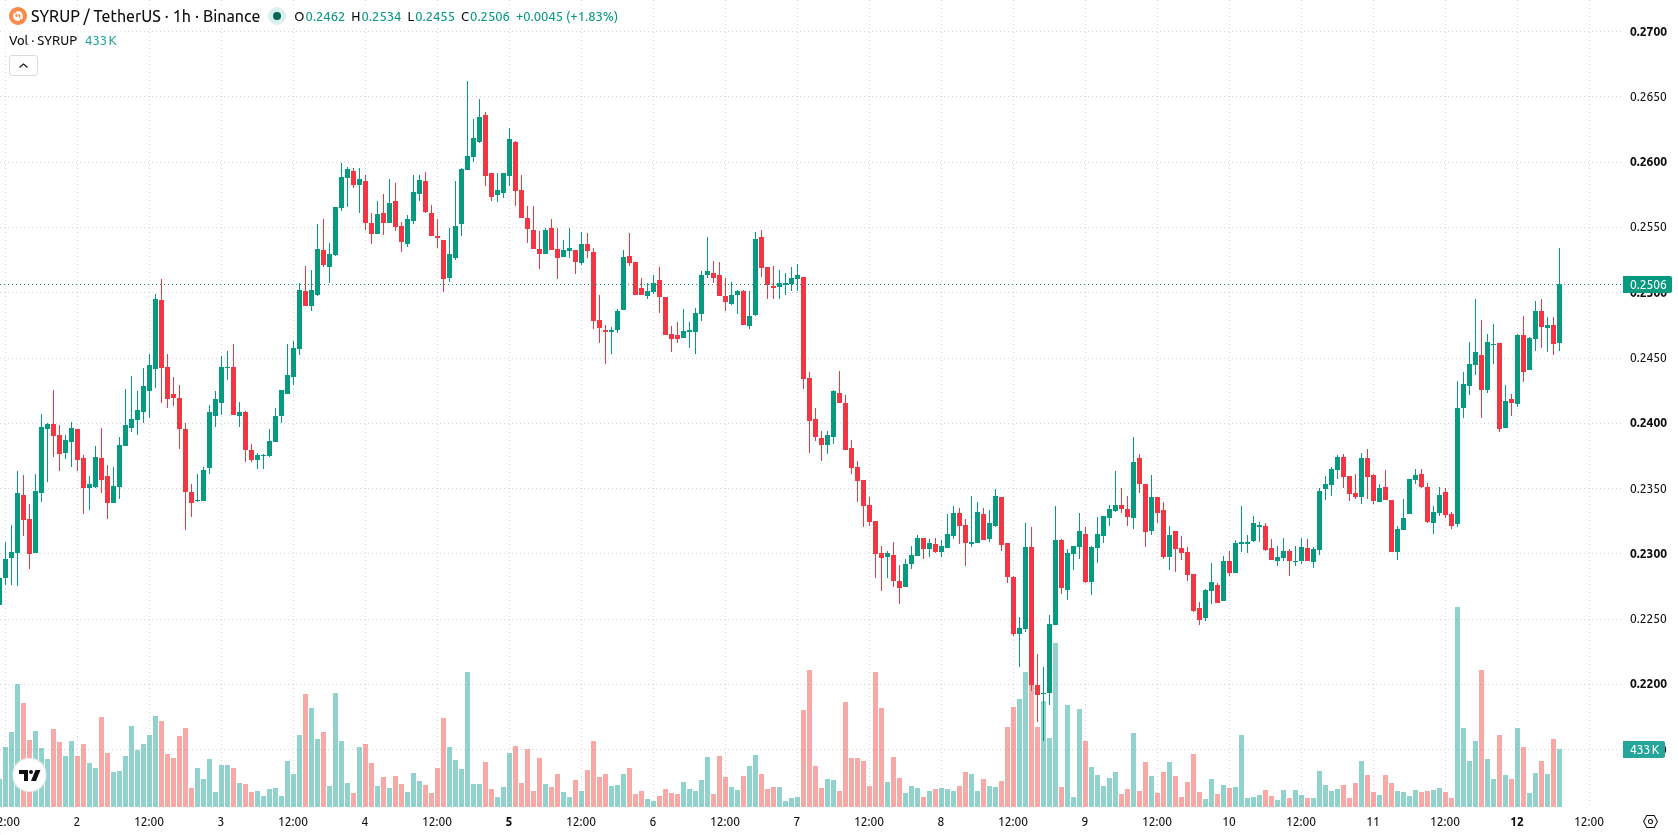
Maple (SYRUP) is trading at $0.253, up 7.29% on the day and holding near the session high. The asset maintains a position above its key moving averages, reflecting continued upward momentum.
 0.1008
0.1415
Highlights
- SYRUP/USD trades above key moving averages on multiple timeframes, confirming positive momentum across short, medium, and long term.
- Bullish signals dominate most momentum indicators, including MACD and ADX, while a minor divergence risk is present and Stoch RSI reads as neutral.
- Price recently gained 7.29% to $0.253, with the projected range for 2 to 3 days at $0.2389 to $0.2618 and limited downside risk.
Bullish signals persist as intraday buyers dominate technical indicators
On the technical front, SYRUP/USD remains above the MA-20 at $0.2429 and MA-50 at $0.2371 on the H1 timeframe, with daily chart support from the MA-200 at $0.1939. The Ichimoku Kijun is at $0.2405, serving as immediate support. Momentum indicators reinforce the bullish stance: both MACD and ADX currently signal buying, while Bull/Bear Power indicates intraday buyer dominance. RSI stands at 59.9 and CCI also registers a buy reading; Stoch RSI is neutral, suggesting no strong overbought or oversold condition. The Awesome Oscillator supports the prevailing uptrend, and price action has left only minor divergence between indicators and the recent move.
Upside potential limited by range-bound outlook and volatility risk
Over the next two to three trading days, the expected price range is $0.2389–$0.2618, reflecting typical volatility relative to current levels. There is a very high probability of further upside, though the baseline scenario envisions the price trading without clear direction within this band. Should bullish momentum resume, an advance beyond upper resistance may unfold, while renewed selling could see the price slip below immediate support at the Kijun level.
Earlier, analysts noted that Maple was experiencing short-term downside momentum within a broader bullish trend, with volatility driven by mixed technical indicators. The current market narrative adds confirmation of strengthening bullish momentum, and traders should monitor the $0.2389–$0.2618 range for signs of a breakout or a reversal.










-
 Afghanistan
-
 Albania
-
 Algeria
-
 Angola
-
 Argentina
-
 Armenia
-
 Australia
-
 Austria
-
 Azerbaijan
-
 Bahamas
-
 Bahrain
-
 Bangladesh
-
 Belarus
-
 Belgium
-
 Bolivia
-
 Botswana
-
 Brazil
-
 Brunei
-
 Bulgaria
-
 Cambodia
-
 Cameroon
-
 Canada
-
 Chile
-
 China
-
 Colombia
-
 Congo
-
 Costa Rica
-
 Cote d'Ivoire
-
 Croatia
-
 Cuba
-
 Cyprus
-
 Czechia
-
 DR Congo
-
 Denmark
-
 Dominican Republic
-
 Ecuador
-
 Egypt
-
 El Salvador
-
 Estonia
-
 Eswatini
-
 Ethiopia
-
 Finland
-
 France
-
 Georgia
-
 Germany
-
 Ghana
-
 Greece
-
 Haiti
-
 Hong Kong
-
 Hungary
-
 India
-
 Indonesia
-
 Iran, Islamic republic
-
 Iraq
-
 Ireland
-
 Israel
-
 Italy
-
 Jamaica
-
 Japan
-
 Jordan
-
 Kazakhstan
-
 Kenya
-
 Korea
-
 Kuwait
-
 Kyrgyzstan
-
 Laos
-
 Latvia
-
 Lebanon
-
 Lesotho
-
 Libya
-
 Lithuania
-
 Luxembourg
-
 Madagascar
-
 Malaysia
-
 Malta
-
 Mauritius
-
 Mexico
-
 Moldova
-
 Mongolia
-
 Montenegro
-
 Morocco
-
 Mozambique
-
 Myanmar
-
 Namibia
-
 Nepal
-
 Netherlands
-
 New Zealand
-
 Nigeria
-
 North Macedonia
-
 Norway
-
 Oman
-
 Pakistan
-
 Palestine
-
 Panama
-
 Papua New Guinea
-
 Paraguay
-
 Peru
-
 Philippines
-
 Poland
-
 Portugal
-
 Puerto Rico
-
 Qatar
-
 Reunion
-
 Romania
-
 Rwanda
-
 Saudi Arabia
-
 Serbia
-
 Singapore
-
 Slovakia
-
 Slovenia
-
 Somalia
-
 South Africa
-
 Spain
-
 Sri Lanka
-
 Sweden
-
 Switzerland
-
 Syria
-
 Taiwan
-
 Tajikistan
-
 Tanzania
-
 Thailand
-
 Trinidad and Tobago
-
 Tunisia
-
 Turkey
-
 UAE
-
 Uganda
-
 Ukraine
-
 United Kingdom
-
United States
-
 Uruguay
-
 Uzbekistan
-
 Venezuela
-
 Vietnam
-
 Yemen
-
 Zambia
-
 Zimbabwe
- Forex
- Crypto












