

Quant weekly outlook: Can tokenized deposit trials by major banks drive renewed upside?

Institutional momentum continues to shape the outlook for Quant (QNT), which is trading near $238 following a pullback of more than 6% over the last week. With buyers having tested higher but momentum now looking stretched, investors are watching closely as a series of high-profile integrations keep the asset in focus. The week ahead will hinge on whether institutional adoption can sustain demand in the face of emerging resistance.
 193.7
208.670000
Highlights
- Quant is trading at $237.71 after falling 6.13% in the past 7 days, maintaining a long-term bullish structure above key trend levels.
- Technical indicators show buy momentum remains firm, but the asset approaches overbought conditions and short-term exhaustion.
- Quant is projected to trade between $211.51177 and $263.908229 over the next week, with $220.63 as critical support and $270.14 as resistance.
Bank trials and central bank pilots drive speculation on Quant’s adoption
Quant (QNT) garnered increased attention as major banks including HSBC UK, Barclays, and Lloyds began tokenized deposit trials using its infrastructure, according to Yahoo Finance and CCN, highlighting Quant's growing footprint in automated interbank payments. The Clearing House in the US has also selected Quant to supply payment technology, sparking further activity since late September. Additionally, CCN noted that the European Central Bank expanded its digital euro test to include Quant’s technology for conditional payments, signaling ongoing institutional engagement.
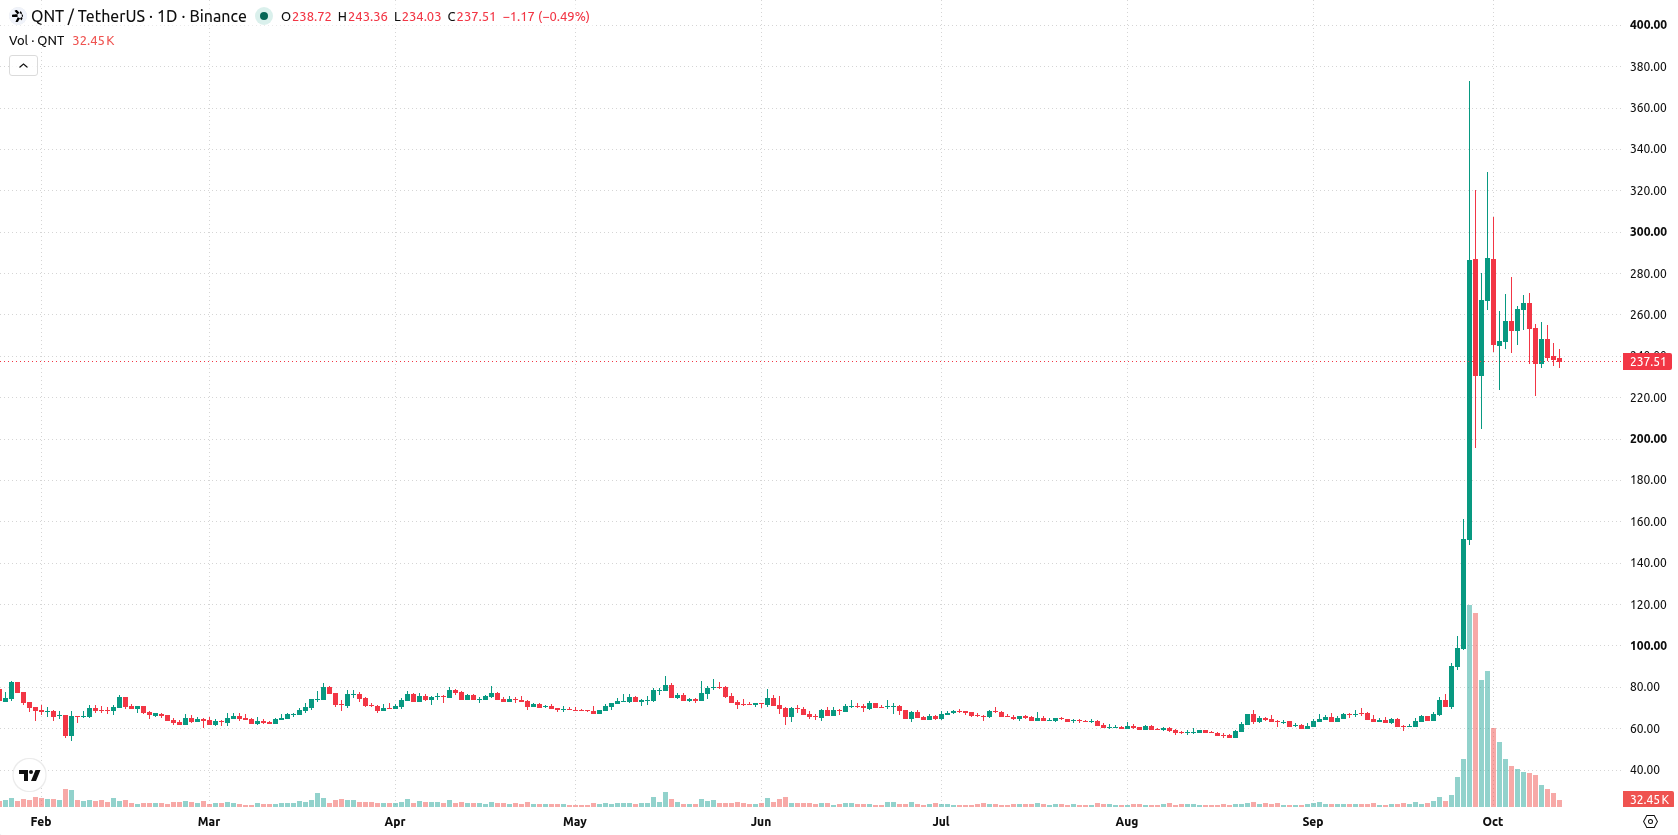
Momentum signals diverge as bullish pressure meets key resistance this week
On the daily chart, the technical setup remains directional, marked by a sustained move lower with a firm trend as shown by the 22.44% volatility over the past week. Despite the drop, MACD shows strong buy momentum at 46.459343, but the RSI reading of 62.909494 is approaching overbought conditions, revealing some tension between trend strength and exhaustion. Price sits securely above the Ichimoku Kijun at $215.875, making $220.63 the key support level and $270.14 the next resistance. This setup suggests bullish momentum is intact, but nearby resistance may slow gains.
Upside bias prevails barring a break below pivotal support
Over the next 7 days, Quant is expected to trade between $211.51177 and $263.908229. The probability of an increase stands at 75%, with a 25% chance of a decline. The base case is a continued advance within the projected range, provided $220.63 support holds. A break above $270.14 opens up room for accelerated gains, while a dip below $220.63 would expose further downside.
Earlier, analysts noted that Quant’s strengthening role in institutional settlement networks was supporting a bullish trajectory for the asset. The current technical setup adds a potential inflection point, with a sustained move above $270.14 serving as the next level to watch for further upside.











-
 Afghanistan
-
 Albania
-
 Algeria
-
 Angola
-
 Argentina
-
 Armenia
-
 Australia
-
 Austria
-
 Azerbaijan
-
 Bahamas
-
 Bahrain
-
 Bangladesh
-
 Belarus
-
 Belgium
-
 Bolivia
-
 Botswana
-
 Brazil
-
 Brunei
-
 Bulgaria
-
 Cambodia
-
 Cameroon
-
 Canada
-
 Chile
-
 China
-
 Colombia
-
 Congo
-
 Costa Rica
-
 Cote d'Ivoire
-
 Croatia
-
 Cuba
-
 Cyprus
-
 Czechia
-
 DR Congo
-
 Denmark
-
 Dominican Republic
-
 Ecuador
-
 Egypt
-
 El Salvador
-
 Estonia
-
 Eswatini
-
 Ethiopia
-
 Finland
-
 France
-
 Georgia
-
 Germany
-
 Ghana
-
 Greece
-
 Haiti
-
 Hong Kong
-
 Hungary
-
 India
-
 Indonesia
-
 Iran, Islamic republic
-
 Iraq
-
 Ireland
-
 Israel
-
 Italy
-
 Jamaica
-
 Japan
-
 Jordan
-
 Kazakhstan
-
 Kenya
-
 Korea
-
 Kuwait
-
 Kyrgyzstan
-
 Laos
-
 Latvia
-
 Lebanon
-
 Lesotho
-
 Libya
-
 Lithuania
-
 Luxembourg
-
 Madagascar
-
 Malaysia
-
 Malta
-
 Mauritius
-
 Mexico
-
 Moldova
-
 Mongolia
-
 Montenegro
-
 Morocco
-
 Mozambique
-
 Myanmar
-
 Namibia
-
 Nepal
-
 Netherlands
-
 New Zealand
-
 Nigeria
-
 North Macedonia
-
 Norway
-
 Oman
-
 Pakistan
-
 Palestine
-
 Panama
-
 Papua New Guinea
-
 Paraguay
-
 Peru
-
 Philippines
-
 Poland
-
 Portugal
-
 Puerto Rico
-
 Qatar
-
 Reunion
-
 Romania
-
 Rwanda
-
 Saudi Arabia
-
 Serbia
-
 Singapore
-
 Slovakia
-
 Slovenia
-
 Somalia
-
 South Africa
-
 Spain
-
 Sri Lanka
-
 Sweden
-
 Switzerland
-
 Syria
-
 Taiwan
-
 Tajikistan
-
 Tanzania
-
 Thailand
-
 Trinidad and Tobago
-
 Tunisia
-
 Turkey
-
 UAE
-
 Uganda
-
 Ukraine
-
 United Kingdom
-
United States
-
 Uruguay
-
 Uzbekistan
-
 Venezuela
-
 Vietnam
-
 Yemen
-
 Zambia
-
 Zimbabwe
- Forex
- Crypto












