

Flow slides around 10.5% as downside risk persists below key technical levels

Flow (FLOW) slid 10.41% as ongoing technical selling and pressure from short-, medium-, and long-term bearish momentum dominated sentiment. The move is reinforced by the token trading below all major moving averages, highlighting continued downside risk.
 0.0325
0.0385
0.0325
0.0385
Highlights
- FLOW/USD trades below key moving averages, with persistent downward pressure and a 10.41% daily loss to $0.0297.
- Technical indicators present mixed momentum, with some bullish signals but overall market indecision and weak direction.
- The expected range over the next five trading days is $0.025 to $0.0374, with a 50% probability of a move in either direction.
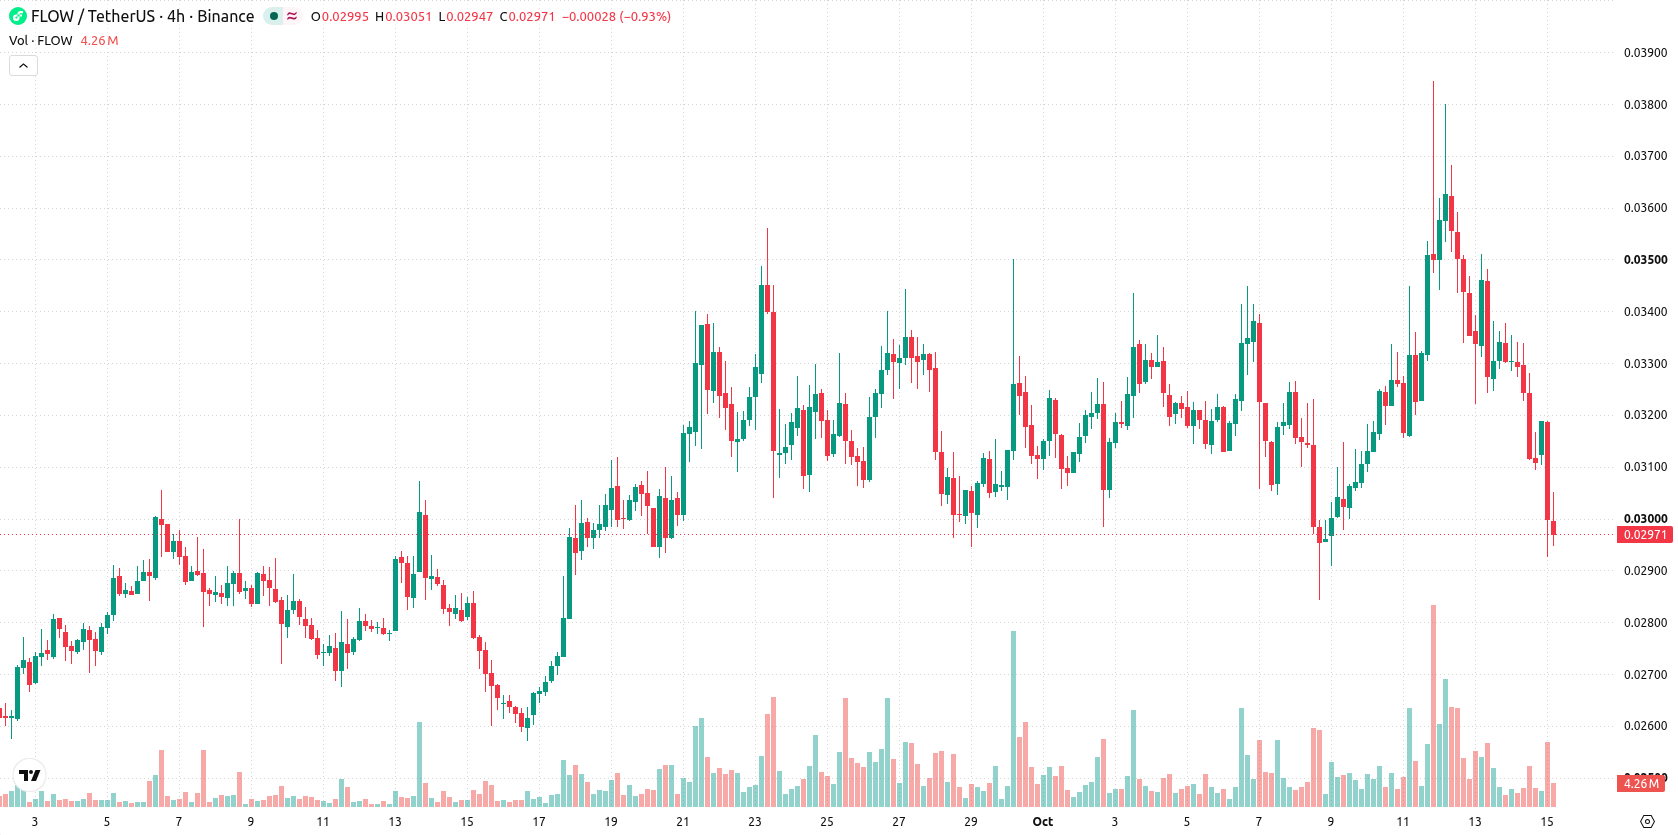
Persistent downside bias as moving averages and signals diverge
FLOW/USD is currently trading below all major moving averages: $0.0321 (MA-20), $0.0301 (MA-50), and $0.0311 (MA-200). This signals persistent selling pressure across short-, medium-, and long-term trends, with a bearish configuration between the MA-50 and MA-200. Near-term resistance is at $0.0301, while support sits at $0.0291. Momentum indicators show mixed signals: MACD and Awesome Oscillator (AO) hint at emerging bullishness, whereas the ADX indicates ongoing trend strength. Both the Relative Strength Index (RSI) and Commodity Channel Index (CCI) remain neutral, just below mid-levels, and the Stochastic RSI is subdued, with no clear overbought or oversold reading. Bull/Bear Power (BBP) at 0.0012 suggests buyers have a slight intraday advantage, but the session is marked by a downward move to $0.0297 and notable volatility at 2.24%. The overall technical setup remains pressured, with mixed signals reflecting market indecision.
Earlier, analysts noted that Flow faced ongoing technical weakness and heightened downside risks amid persistent selling pressure. The latest developments reinforce this bearish outlook, but mixed momentum signals suggest traders should closely monitor for a decisive move above resistance at $0.0301 or a drop below support at $0.0291 as key inflection points in the coming sessions.









-
 Afghanistan
-
 Albania
-
 Algeria
-
 Angola
-
 Argentina
-
 Armenia
-
 Australia
-
 Austria
-
 Azerbaijan
-
 Bahamas
-
 Bahrain
-
 Bangladesh
-
 Belarus
-
 Belgium
-
 Bolivia
-
 Botswana
-
 Brazil
-
 Brunei
-
 Bulgaria
-
 Cambodia
-
 Cameroon
-
 Canada
-
 Chile
Chile
-
 China
China
-
 Colombia
-
 Congo
Congo
-
 Costa Rica
-
 Cote d'Ivoire
-
 Croatia
-
 Cuba
Cuba
-
 Cyprus
-
 Czechia
-
 DR Congo
-
 Denmark
-
 Dominican Republic
-
 Ecuador
-
 Egypt
Egypt
-
 El Salvador
-
 Estonia
-
 Eswatini
-
 Ethiopia
-
 Finland
-
 France
-
 Georgia
-
 Germany
-
 Ghana
Ghana
-
 Greece
-
 Haiti
Haiti
-
 Hong Kong
-
 Hungary
-
 India
India
-
 Indonesia
-
 Iran, Islamic republic
-
 Iraq
Iraq
-
 Ireland
-
 Israel
-
 Italy
Italy
-
 Jamaica
-
 Japan
Japan
-
 Jordan
-
 Kazakhstan
-
 Kenya
Kenya
-
 Korea
Korea
-
 Kuwait
-
 Kyrgyzstan
-
 Laos
Laos
-
 Latvia
-
 Lebanon
-
 Lesotho
-
 Libya
Libya
-
 Lithuania
-
 Luxembourg
-
 Madagascar
-
 Malaysia
-
 Malta
Malta
-
 Mauritius
-
 Mexico
-
 Moldova
-
 Mongolia
-
 Montenegro
-
 Morocco
-
 Mozambique
-
 Myanmar
-
 Namibia
-
 Nepal
Nepal
-
 Netherlands
-
 New Zealand
-
 Nigeria
-
 North Macedonia
-
 Norway
-
 Oman
Oman
-
 Pakistan
-
 Palestine
-
 Panama
-
 Papua New Guinea
-
 Paraguay
-
 Peru
Peru
-
 Philippines
-
 Poland
-
 Portugal
-
 Puerto Rico
-
 Qatar
Qatar
-
 Reunion
-
 Romania
-
 Rwanda
-
 Saudi Arabia
-
 Serbia
-
 Singapore
-
 Slovakia
-
 Slovenia
-
 Somalia
-
 South Africa
-
 Spain
Spain
-
 Sri Lanka
-
 Sweden
-
 Switzerland
-
 Syria
Syria
-
 Taiwan
-
 Tajikistan
-
 Tanzania
-
 Thailand
-
 Trinidad and Tobago
-
 Tunisia
-
 Turkey
-
 UAE
UAE
-
 Uganda
-
 Ukraine
-
 United Kingdom
-
United States
-
 Uruguay
-
 Uzbekistan
-
 Venezuela
-
 Vietnam
-
 Yemen
Yemen
-
 Zambia
-
 Zimbabwe
- Forex
- Crypto












