

Quant price outlook: Downside risk persists as sellers dominate short-term action

Quant (QNT) is trading at $194.84, marking a daily decline of 7.08%. The asset currently sits below its key short- and medium-term moving averages but remains above the long-term average, reflecting contrasting pressures across timeframes.
 208.67
223.960000
Highlights
- Quant was selected by The Clearing House to provide interoperability tech for its regulated On-Chain Money Initiative for clearing tokenized deposits.
- Participation in this major U.S. financial infrastructure project increases Quant's institutional credibility, but immediate market impact appears limited.
- QNT/USD trades below key short- and medium-term moving averages with negative momentum signals, facing a high probability of further downside within a $182.36 to $213.19 range.
Long-term institutional prospects rise as short-term pressures persist
Quant has been chosen by The Clearing House to provide the interoperability and orchestration technology for its On-Chain Money Initiative, a regulated network designed to clear tokenized deposits, according to Tickeron. The selection positions Quant within a major U.S. financial infrastructure project, enhancing its credibility and signaling future institutional demand for its solutions. This initiative’s long timeline means its immediate impact is limited, though price action has remained under broader selling pressure.
Sharp intraday volatility builds as signals clash below key resistances
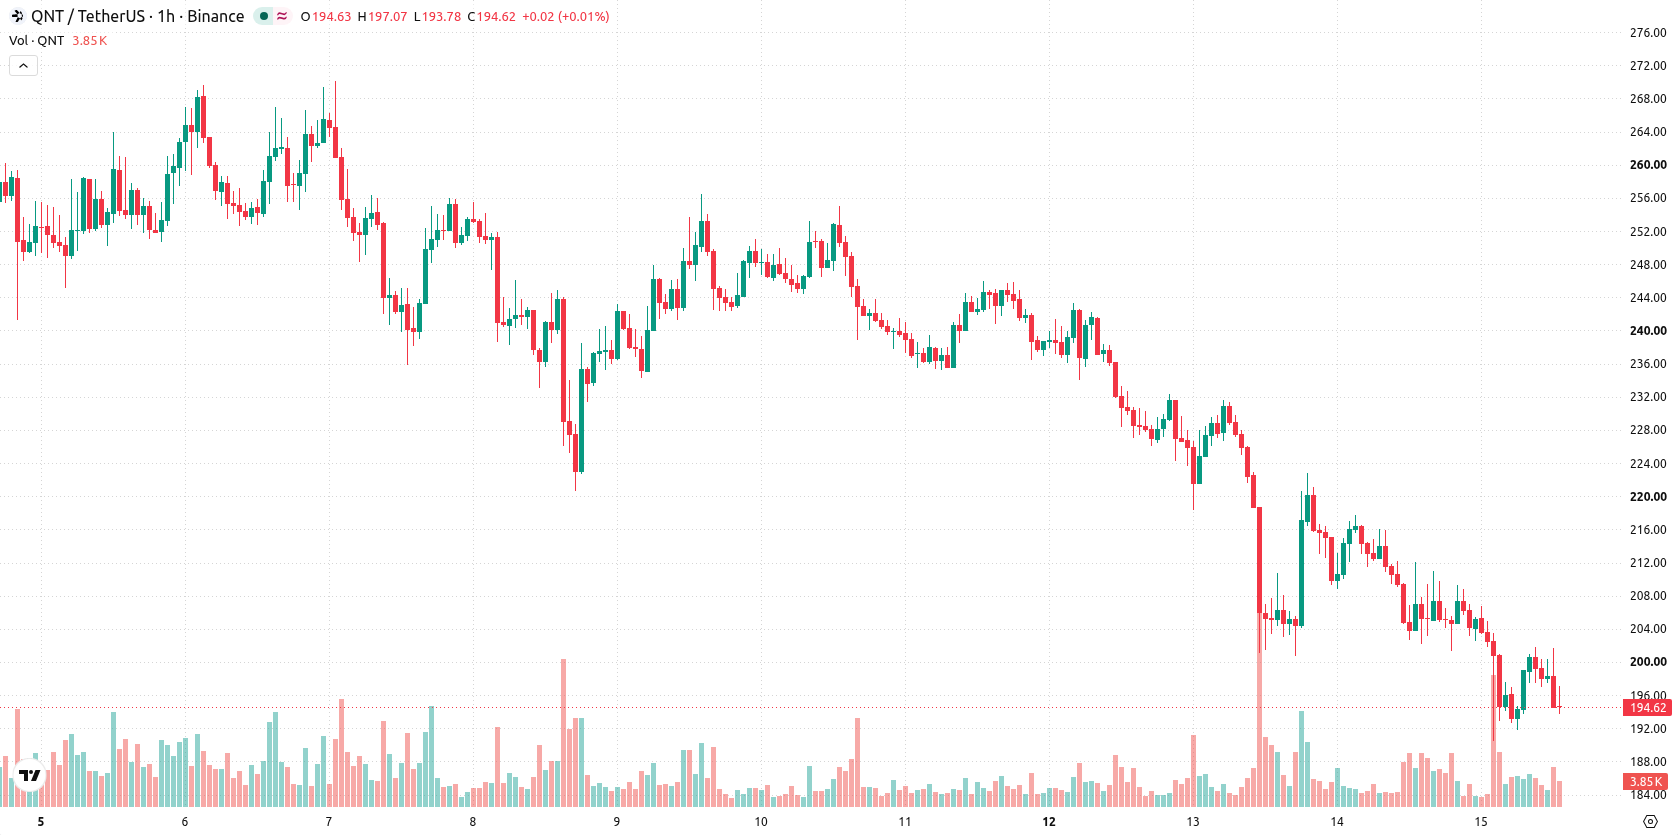
On the hourly chart, QNT/USD trades below the MA-20 at $200.87 and the MA-50 at $206.50, while remaining considerably above the MA-200 at $84.70. The Ichimoku Kijun level acts as immediate resistance at $201.215. Momentum indicators show persistent selling pressure: MACD issues a Strong Sell signal and ADX confirms active selling strength. RSI reads 42.59, consistent with a Sell bias. Stoch RSI is Overbought, contrasting with the oversold readings from Bull/Bear Power and a Neutral stance from CCI and the Awesome Oscillator. The price sits near today's low after a sharp gap down, underscoring strong intraday volatility and a conflicted technical setup.
Downside risks dominate as price threatens range floor
Looking ahead, QNT/USD is expected to trade within a volatile range of $182.36 to $213.19. Downside potential outweighs the probability of a bullish reversal, with a high likelihood of further declines in the short-term scenario. If price sustains above $182.36, consolidation within the current corridor is likely; a break above $201.215 would open the door for a test of the upper range, while a decisive move below $182.36 could lead to accelerated downside momentum.
Earlier, analysts noted that Quant was under persistent selling pressure and at risk of further short-term declines as technical signals weakened. The latest price action confirms this bearish outlook, with downside potential remaining elevated and the $182.36 level serving as a critical support to monitor for signs of deeper losses.











-
 Afghanistan
-
 Albania
-
 Algeria
-
 Angola
-
 Argentina
-
 Armenia
-
 Australia
-
 Austria
-
 Azerbaijan
-
 Bahamas
-
 Bahrain
-
 Bangladesh
-
 Belarus
-
 Belgium
-
 Bolivia
-
 Botswana
-
 Brazil
-
 Brunei
-
 Bulgaria
-
 Cambodia
-
 Cameroon
-
 Canada
-
 Chile
-
 China
-
 Colombia
-
 Congo
-
 Costa Rica
-
 Cote d'Ivoire
-
 Croatia
-
 Cuba
-
 Cyprus
-
 Czechia
-
 DR Congo
-
 Denmark
-
 Dominican Republic
-
 Ecuador
-
 Egypt
-
 El Salvador
-
 Estonia
-
 Eswatini
-
 Ethiopia
-
 Finland
-
 France
-
 Georgia
-
 Germany
-
 Ghana
-
 Greece
-
 Haiti
-
 Hong Kong
-
 Hungary
-
 India
-
 Indonesia
-
 Iran, Islamic republic
-
 Iraq
-
 Ireland
-
 Israel
-
 Italy
-
 Jamaica
-
 Japan
-
 Jordan
-
 Kazakhstan
-
 Kenya
-
 Korea
-
 Kuwait
-
 Kyrgyzstan
-
 Laos
-
 Latvia
-
 Lebanon
-
 Lesotho
-
 Libya
-
 Lithuania
-
 Luxembourg
-
 Madagascar
-
 Malaysia
-
 Malta
-
 Mauritius
-
 Mexico
-
 Moldova
-
 Mongolia
-
 Montenegro
-
 Morocco
-
 Mozambique
-
 Myanmar
-
 Namibia
-
 Nepal
-
 Netherlands
-
 New Zealand
-
 Nigeria
-
 North Macedonia
-
 Norway
-
 Oman
-
 Pakistan
-
 Palestine
-
 Panama
-
 Papua New Guinea
-
 Paraguay
-
 Peru
-
 Philippines
-
 Poland
-
 Portugal
-
 Puerto Rico
-
 Qatar
-
 Reunion
-
 Romania
-
 Rwanda
-
 Saudi Arabia
-
 Serbia
-
 Singapore
-
 Slovakia
-
 Slovenia
-
 Somalia
-
 South Africa
-
 Spain
-
 Sri Lanka
-
 Sweden
-
 Switzerland
-
 Syria
-
 Taiwan
-
 Tajikistan
-
 Tanzania
-
 Thailand
-
 Trinidad and Tobago
-
 Tunisia
-
 Turkey
-
 UAE
-
 Uganda
-
 Ukraine
-
 United Kingdom
-
United States
-
 Uruguay
-
 Uzbekistan
-
 Venezuela
-
 Vietnam
-
 Yemen
-
 Zambia
-
 Zimbabwe
- Forex
- Crypto












