

QNT dips as selling pressure outweighs oversold reversal signs

Quant (QNT) is trading at $213.44, having fallen 7.67% over the last 24 hours. The asset currently sits above its short-term moving average but remains under key medium-term levels, while long-term technicals retain a positive structure.
 206.04
245.970000
206.04
245.970000
Highlights
- Quant surged from $204 to $213 in one hour on October 13 during a rapid short squeeze, triggering $50,000 in short liquidations across Binance, Bybit and OKX.
- No long liquidations were reported during this period, although the token remains under overall selling pressure in the broader market.
- Bearish momentum prevails on major technical indicators, with price forecast to stay between $197.52 and $225.92 over the next two days and a high probability of further downside.
Short squeeze drives spike as broader selling persists
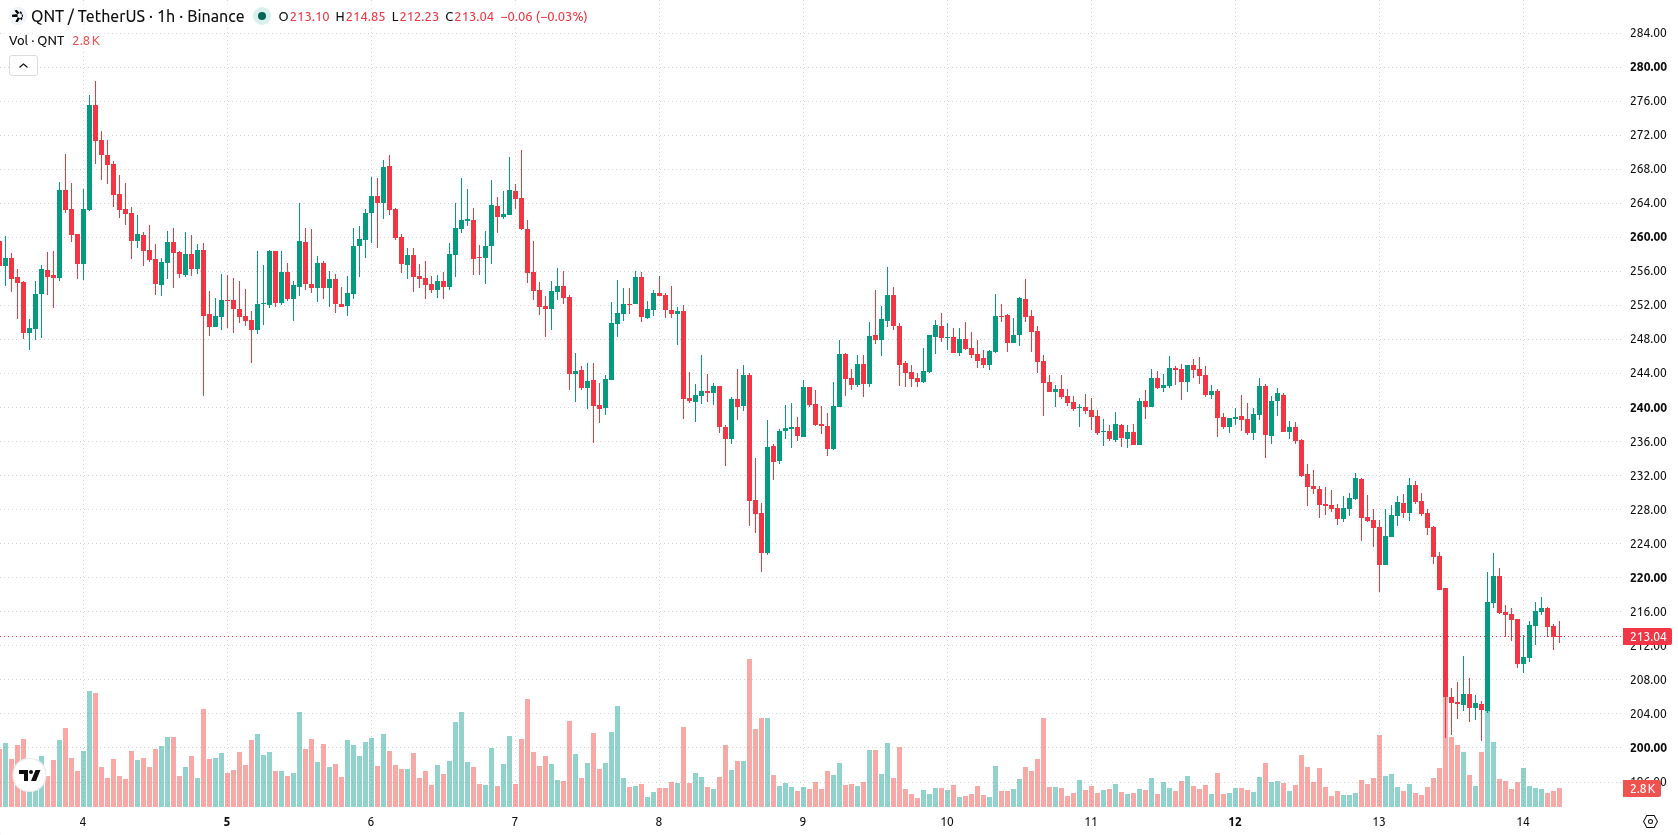
Quant experienced a rapid upward move between $204 and $213 within a single hour on October 13, suggesting a brief period of aggressive buying or immediate short position closures. This was accompanied by $50,000 in short liquidations across Binance, Bybit and OKX, with no reported long liquidations during that hour, according to Tokenpost. These events point to a swift short squeeze in the derivatives market, though price action has remained under broader selling pressure.
Bearish momentum builds as resistance holds and signals diverge
On the hourly chart, QNT is currently positioned above the MA-20 but below the MA-50, with the daily (D1) price sitting above the MA-200. The Ichimoku Kijun on the daily timeframe is at $216.19, representing the nearest overhead resistance, while $197.52 marks a key support zone. MACD and ADX both signal a strong Sell, indicating an active downward trend, while RSI reads at 44 and leans weakly bearish but not yet oversold. Stochastic RSI and CCI both register as Neutral, pointing to indecision among intraday oscillators. Bull/Bear Power signals an oversold state with sellers prevailing, while the Awesome Oscillator offers a Neutral reading and does not reinforce either side.
Limited upside outlook as support risks accelerate downside
Looking ahead over the next 1–2 trading days, QNT is expected to trade within the $197.52 to $225.92 range, a typical volatility band relative to current levels. The probability of an upside move is assessed as very low, while the likelihood of further declines is high if selling momentum persists. A bullish scenario would see the price break above the $216.19 resistance marker, whereas a failure to hold above support at $197.52 could trigger deeper short-term losses.
Earlier, analysts noted that Quant was facing persistent selling pressure and heightened downside risk as technical signals weakened. The latest price action extends this bearish narrative, with traders advised to watch the $197.52 support closely as a potential trigger for increased volatility or deeper short-term declines.









-
 Afghanistan
-
 Albania
-
 Algeria
-
 Angola
-
 Argentina
-
 Armenia
-
 Australia
-
 Austria
-
 Azerbaijan
-
 Bahamas
-
 Bahrain
-
 Bangladesh
-
 Belarus
-
 Belgium
-
 Bolivia
-
 Botswana
-
 Brazil
-
 Brunei
-
 Bulgaria
-
 Cambodia
-
 Cameroon
-
 Canada
-
 Chile
Chile
-
 China
China
-
 Colombia
-
 Congo
Congo
-
 Costa Rica
-
 Cote d'Ivoire
-
 Croatia
-
 Cuba
Cuba
-
 Cyprus
-
 Czechia
-
 DR Congo
-
 Denmark
-
 Dominican Republic
-
 Ecuador
-
 Egypt
Egypt
-
 El Salvador
-
 Estonia
-
 Eswatini
-
 Ethiopia
-
 Finland
-
 France
-
 Georgia
-
 Germany
-
 Ghana
Ghana
-
 Greece
-
 Haiti
Haiti
-
 Hong Kong
-
 Hungary
-
 India
India
-
 Indonesia
-
 Iran, Islamic republic
-
 Iraq
Iraq
-
 Ireland
-
 Israel
-
 Italy
Italy
-
 Jamaica
-
 Japan
Japan
-
 Jordan
-
 Kazakhstan
-
 Kenya
Kenya
-
 Korea
Korea
-
 Kuwait
-
 Kyrgyzstan
-
 Laos
Laos
-
 Latvia
-
 Lebanon
-
 Lesotho
-
 Libya
Libya
-
 Lithuania
-
 Luxembourg
-
 Madagascar
-
 Malaysia
-
 Malta
Malta
-
 Mauritius
-
 Mexico
-
 Moldova
-
 Mongolia
-
 Montenegro
-
 Morocco
-
 Mozambique
-
 Myanmar
-
 Namibia
-
 Nepal
Nepal
-
 Netherlands
-
 New Zealand
-
 Nigeria
-
 North Macedonia
-
 Norway
-
 Oman
Oman
-
 Pakistan
-
 Palestine
-
 Panama
-
 Papua New Guinea
-
 Paraguay
-
 Peru
Peru
-
 Philippines
-
 Poland
-
 Portugal
-
 Puerto Rico
-
 Qatar
Qatar
-
 Reunion
-
 Romania
-
 Rwanda
-
 Saudi Arabia
-
 Serbia
-
 Singapore
-
 Slovakia
-
 Slovenia
-
 Somalia
-
 South Africa
-
 Spain
Spain
-
 Sri Lanka
-
 Sweden
-
 Switzerland
-
 Syria
Syria
-
 Taiwan
-
 Tajikistan
-
 Tanzania
-
 Thailand
-
 Trinidad and Tobago
-
 Tunisia
-
 Turkey
-
 UAE
UAE
-
 Uganda
-
 Ukraine
-
 United Kingdom
-
United States
-
 Uruguay
-
 Uzbekistan
-
 Venezuela
-
 Vietnam
-
 Yemen
Yemen
-
 Zambia
-
 Zimbabwe
- Forex
- Crypto












