


Quant (QNT) fell 7.74% today as technical momentum turned sharply bearish, with sellers maintaining firm control throughout the session. The move is supported by the price trending below both the 20-day and 50-day moving averages, highlighting persistent short- and medium-term pressure.
 161.03
203.860000
Highlights
- QNT/USD is trading below short- and medium-term moving averages but remains above its 200-day moving average, maintaining a bullish long-term structure.
- Momentum indicators show prevailing selling pressure with MACD bearish, weak trend strength, and most oscillators in oversold zones.
- Next five days expected to see QNT/USD trade between $144.4 and $184.61 with a 61% probability of a downward move.
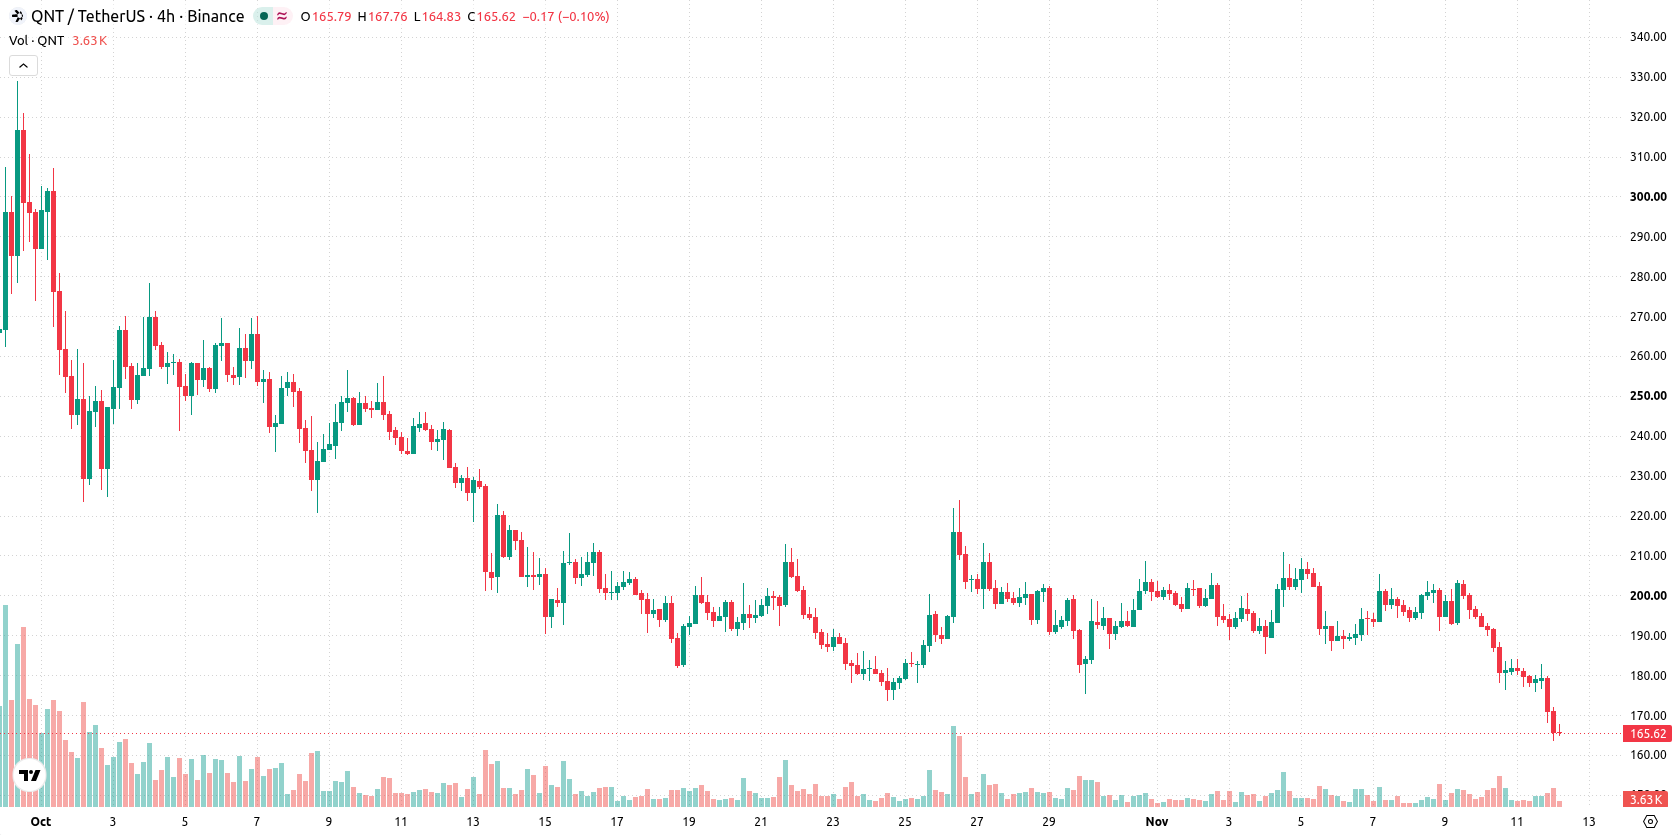
Medium-term weakness persists as major indicators flash downtrend
QNT/USD is trading under sustained selling pressure, sitting below its 20-day and 50-day moving averages ($192.6185 and $205.9562), which signals weakness in both short- and medium-term trends. Despite this, the price continues to hold above the 200-day moving average at $101.51435, which suggests the long-term structure remains bullish. Immediate resistance is at $168.05, while the nearest support comes at $165.36. Most momentum indicators, including MACD and the Awesome Oscillator, point to a bearish set-up, while the ADX shows the prevailing downtrend has low strength. The RSI stands neutral, but the Stochastic RSI and Commodity Channel Index are both in oversold territory, indicating selling exhaustion for these specific oscillators. Bull/Bear Power is negative, confirming the dominance of sellers within intraday trading.
Earlier, analysts noted that Quant was under short- and medium-term selling pressure, even as its longer-term structure remained intact. The current analysis not only reinforces this bearish trend with sharper momentum readings, but also highlights that traders should closely monitor the $144.40–$184.61 corridor for potential volatility-driven breakouts in the coming sessions.










-
 Afghanistan
-
 Albania
-
 Algeria
-
 Angola
-
 Argentina
-
 Armenia
-
 Australia
-
 Austria
-
 Azerbaijan
-
 Bahamas
-
 Bahrain
-
 Bangladesh
-
 Belarus
-
 Belgium
-
 Bolivia
-
 Botswana
-
 Brazil
-
 Brunei
-
 Bulgaria
-
 Cambodia
-
 Cameroon
-
 Canada
-
 Chile
-
 China
-
 Colombia
-
 Congo
-
 Costa Rica
-
 Cote d'Ivoire
-
 Croatia
-
 Cuba
-
 Cyprus
-
 Czechia
-
 DR Congo
-
 Denmark
-
 Dominican Republic
-
 Ecuador
-
 Egypt
-
 El Salvador
-
 Estonia
-
 Eswatini
-
 Ethiopia
-
 Finland
-
 France
-
 Georgia
-
 Germany
-
 Ghana
-
 Greece
-
 Haiti
-
 Hong Kong
-
 Hungary
-
 India
-
 Indonesia
-
 Iran, Islamic republic
-
 Iraq
-
 Ireland
-
 Israel
-
 Italy
-
 Jamaica
-
 Japan
-
 Jordan
-
 Kazakhstan
-
 Kenya
-
 Korea
-
 Kuwait
-
 Kyrgyzstan
-
 Laos
-
 Latvia
-
 Lebanon
-
 Lesotho
-
 Libya
-
 Lithuania
-
 Luxembourg
-
 Madagascar
-
 Malaysia
-
 Malta
-
 Mauritius
-
 Mexico
-
 Moldova
-
 Mongolia
-
 Montenegro
-
 Morocco
-
 Mozambique
-
 Myanmar
-
 Namibia
-
 Nepal
-
 Netherlands
-
 New Zealand
-
 Nigeria
-
 North Macedonia
-
 Norway
-
 Oman
-
 Pakistan
-
 Palestine
-
 Panama
-
 Papua New Guinea
-
 Paraguay
-
 Peru
-
 Philippines
-
 Poland
-
 Portugal
-
 Puerto Rico
-
 Qatar
-
 Reunion
-
 Romania
-
 Rwanda
-
 Saudi Arabia
-
 Serbia
-
 Singapore
-
 Slovakia
-
 Slovenia
-
 Somalia
-
 South Africa
-
 Spain
-
 Sri Lanka
-
 Sweden
-
 Switzerland
-
 Syria
-
 Taiwan
-
 Tajikistan
-
 Tanzania
-
 Thailand
-
 Trinidad and Tobago
-
 Tunisia
-
 Turkey
-
 UAE
-
 Uganda
-
 Ukraine
-
 United Kingdom
-
United States
-
 Uruguay
-
 Uzbekistan
-
 Venezuela
-
 Vietnam
-
 Yemen
-
 Zambia
-
 Zimbabwe
- Forex
- Crypto












