

Quant falls around 10.5% as futures open interest drops and sellers dominate

Quant (QNT) slumped 10.47% as futures open interest receded from previous highs, reflecting a pullback in speculative activity. The drop is further supported by QNT/USD falling below its 20-day moving average and encountering renewed selling pressure near the day's lows.
 231.67
270.140000
231.67
270.140000
Highlights
- Quant's QNT futures open interest declined from a peak of $190 million to about $120 million during increased volatility and price swings.
- Shifting open interest and funding rates suggest market participants are adjusting exposure amid heightened derivatives activity.
- QNT/USD trades near $206.4 after a sharp drop, with key support at $201.09 and a five-day projected range of $171.72 to $231.155; technical momentum is mixed with potential for short-term stabilization.
Derivatives exposure declines as open interest unwinds from peak
Quant's QNT token recorded a notable decrease in futures open interest, which had previously surged from approximately $11–15 million during a late September breakout to $190 million, before falling back to around $120 million. This shift in derivatives market positioning accompanied increased activity and volatility tied to Quant's recent price movements. Fluctuations in open interest and funding rates were reported, signaling market participants' changing exposure levels.
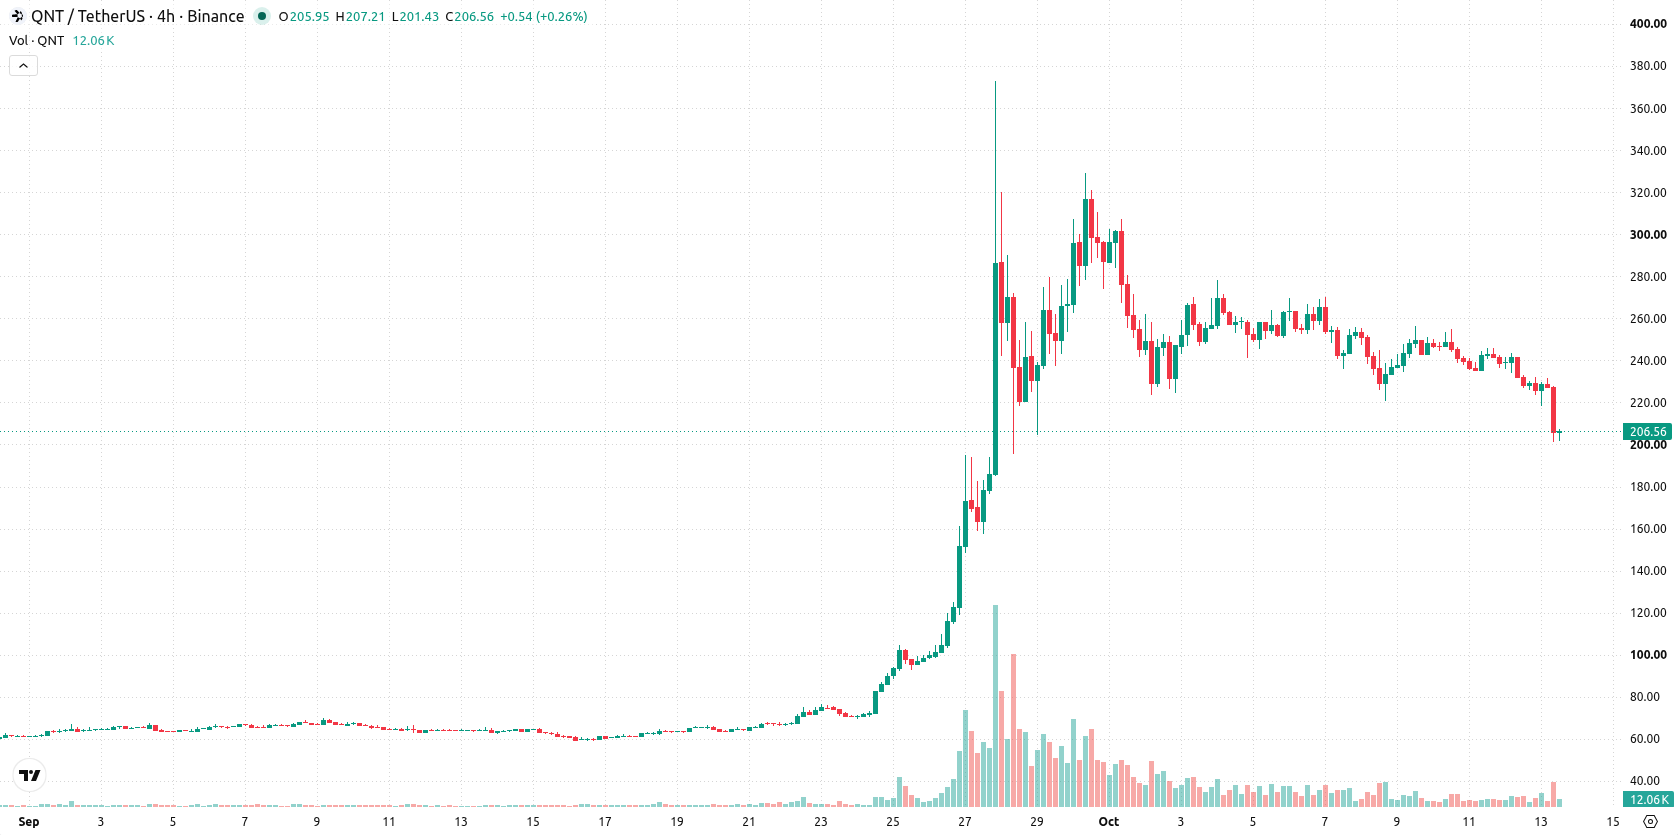
Seller-driven volatility as intraday pressure tests technical supports
QNT/USD is trading below its 20-day moving average (MA-20) at $222.934, but remains well above both the 50-day and 200-day moving averages (MA-50 at $127.6658 and MA-200 at $83.3523), which confirms a bullish medium- and long-term trend structure. For the immediate outlook, resistance lies at $216.685 (Ichimoku Kijun), with support at the day’s low of $201.09. Recent price action suggests short-term pressure from sellers. Momentum signals are mixed: both the Moving Average Convergence Divergence (MACD) and Average Directional Index (ADX) show continued bullish momentum, but Relative Strength Index (RSI) stands at 59.07 (buy forecast), indicating mid-range strength, while Stochastic RSI reads zero and signals an oversold condition. Commodity Channel Index (CCI) is neutral and Bull/Bear Power (BBP) is positive at 10.71, showing buyers dominate intraday momentum, but also indicating overbought conditions. The day is sharply negative with QNT/USD last seen at $206.4, down $24.13 or 10.47%, after a downside gap of about $4.57 and 1.98%. Price is near the session low, intraday volatility is high at 15.21%. The trading tone reflects heavy pressure from sellers after the open, with oversold oscillators signaling potential for near-term stabilization even as some momentum indicators remain bullish.
Earlier, analysts noted that Quant faced persistent selling pressure and a heightened risk of further downside amid weak technical signals. The latest developments show that while selling remains pronounced and intraday volatility is elevated, traders should watch for a potential inflection around the $201.09 support, with volatility suggesting possible sharp moves as the trend develops.










-
 Afghanistan
-
 Albania
-
 Algeria
-
 Angola
-
 Argentina
-
 Armenia
-
 Australia
-
 Austria
-
 Azerbaijan
-
 Bahamas
-
 Bahrain
-
 Bangladesh
-
 Belarus
-
 Belgium
-
 Bolivia
-
 Botswana
-
 Brazil
-
 Brunei
-
 Bulgaria
-
 Cambodia
-
 Cameroon
-
 Canada
-
 Chile
Chile
-
 China
China
-
 Colombia
-
 Congo
Congo
-
 Costa Rica
-
 Cote d'Ivoire
-
 Croatia
-
 Cuba
Cuba
-
 Cyprus
-
 Czechia
-
 DR Congo
-
 Denmark
-
 Dominican Republic
-
 Ecuador
-
 Egypt
Egypt
-
 El Salvador
-
 Estonia
-
 Eswatini
-
 Ethiopia
-
 Finland
-
 France
-
 Georgia
-
 Germany
-
 Ghana
Ghana
-
 Greece
-
 Haiti
Haiti
-
 Hong Kong
-
 Hungary
-
 India
India
-
 Indonesia
-
 Iran, Islamic republic
-
 Iraq
Iraq
-
 Ireland
-
 Israel
-
 Italy
Italy
-
 Jamaica
-
 Japan
Japan
-
 Jordan
-
 Kazakhstan
-
 Kenya
Kenya
-
 Korea
Korea
-
 Kuwait
-
 Kyrgyzstan
-
 Laos
Laos
-
 Latvia
-
 Lebanon
-
 Lesotho
-
 Libya
Libya
-
 Lithuania
-
 Luxembourg
-
 Madagascar
-
 Malaysia
-
 Malta
Malta
-
 Mauritius
-
 Mexico
-
 Moldova
-
 Mongolia
-
 Montenegro
-
 Morocco
-
 Mozambique
-
 Myanmar
-
 Namibia
-
 Nepal
Nepal
-
 Netherlands
-
 New Zealand
-
 Nigeria
-
 North Macedonia
-
 Norway
-
 Oman
Oman
-
 Pakistan
-
 Palestine
-
 Panama
-
 Papua New Guinea
-
 Paraguay
-
 Peru
Peru
-
 Philippines
-
 Poland
-
 Portugal
-
 Puerto Rico
-
 Qatar
Qatar
-
 Reunion
-
 Romania
-
 Rwanda
-
 Saudi Arabia
-
 Serbia
-
 Singapore
-
 Slovakia
-
 Slovenia
-
 Somalia
-
 South Africa
-
 Spain
Spain
-
 Sri Lanka
-
 Sweden
-
 Switzerland
-
 Syria
Syria
-
 Taiwan
-
 Tajikistan
-
 Tanzania
-
 Thailand
-
 Trinidad and Tobago
-
 Tunisia
-
 Turkey
-
 UAE
UAE
-
 Uganda
-
 Ukraine
-
 United Kingdom
-
United States
-
 Uruguay
-
 Uzbekistan
-
 Venezuela
-
 Vietnam
-
 Yemen
Yemen
-
 Zambia
-
 Zimbabwe
- Forex
- Crypto












