

Quant technical analysis: Persistent selling pressure with oversold conditions in play

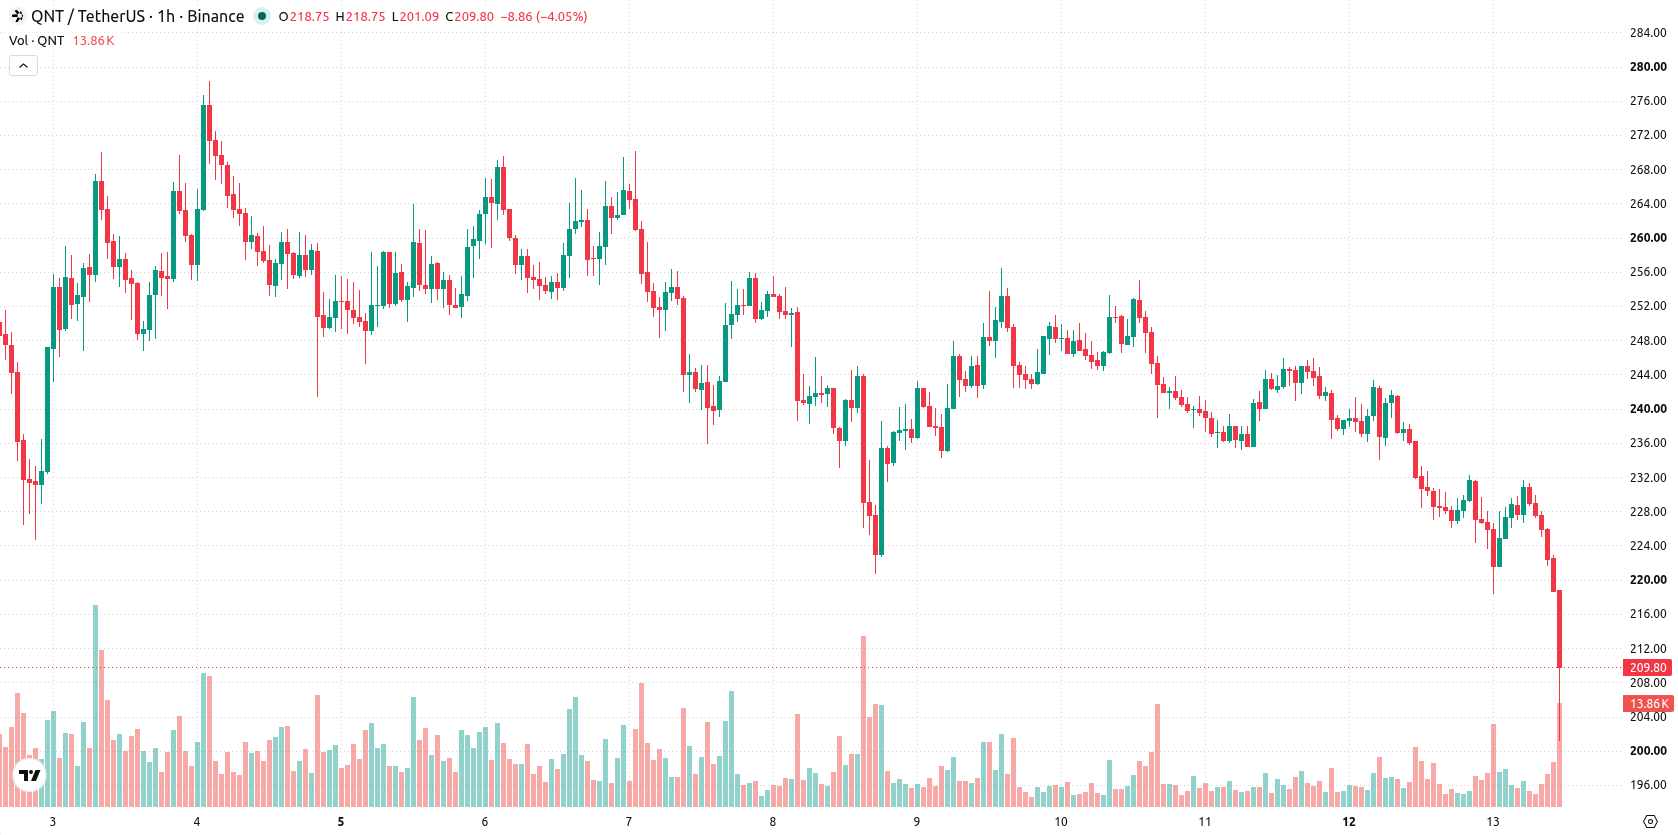
Quant (QNT) is trading at $203.36, sharply down by 13.79% over the last 24 hours. The asset currently sits below its key moving averages.
 231.67
270.140000
231.67
270.140000
Highlights
- Quant maintains a fixed token supply of about 14.88 million, providing a long-term inflation cap for QNT.
- Enterprises and developers create recurring programmatic demand for QNT by locking tokens to pay the £100 Overledger license fee.
- QNT/USD fell 13.79% to $203.36, with momentum indicators all signaling strong, sustained downside and a near-term range of $192.29 to $222.32.
Hard token cap and license demand as price faces selling pressure
Quant maintains a fixed total token supply of about 14.88 million, ensuring a hard cap that limits possible inflation over time. According to the firm's published model, developers and enterprises pay a recurring Overledger license fee of £100, which is settled by acquiring and locking an equivalent amount of QNT for the license term. This structure creates a persistent, programmatic demand for the token when adoption increases, though the price action has remained under broader selling pressure.
Technical indicators align for downside as resistance limits rebound
On the technical front, QNT/USD is trading below the MA-20 at $227.01 and the MA-50 at $234.41 on the H1 chart, while remaining above the long-term MA-200 at $83.35 on the daily timeframe. The Ichimoku Kijun sits at $228.35, serving as immediate resistance. Momentum and oscillator signals remain weak: MACD and ADX both indicate a sell, RSI is at 35.60 in sell territory, Stochastic RSI is neutral, and CCI is oversold. Bull/Bear Power reflects dominant selling intraday, and the Awesome Oscillator also supports selling pressure. All signals are aligned for continued downside with no major divergence observed.
Further declines likely as upside breakout faces resistance
Over the next two to three days, QNT/USD is expected to consolidate within a range of $192.29 to $222.32, reflecting typical volatility under current conditions. The likelihood of upward movement is very low, while the probability of a further decline is high. If QNT/USD breaks above the $228.35 resistance, additional upside momentum is possible, but a sustained move below $192.29 would likely accelerate losses toward deeper support areas.
Earlier, analysts noted that Quant's technical landscape had shifted toward consolidation and increased downside risk following a period of sustained selling pressure. The latest price action not only reinforces this bearish outlook but also underscores the importance of monitoring the $192.29 support level as the next potential inflection point for QNT/USD.










-
 Afghanistan
-
 Albania
-
 Algeria
-
 Angola
-
 Argentina
-
 Armenia
-
 Australia
-
 Austria
-
 Azerbaijan
-
 Bahamas
-
 Bahrain
-
 Bangladesh
-
 Belarus
-
 Belgium
-
 Bolivia
-
 Botswana
-
 Brazil
-
 Brunei
-
 Bulgaria
-
 Cambodia
-
 Cameroon
-
 Canada
-
 Chile
Chile
-
 China
China
-
 Colombia
-
 Congo
Congo
-
 Costa Rica
-
 Cote d'Ivoire
-
 Croatia
-
 Cuba
Cuba
-
 Cyprus
-
 Czechia
-
 DR Congo
-
 Denmark
-
 Dominican Republic
-
 Ecuador
-
 Egypt
Egypt
-
 El Salvador
-
 Estonia
-
 Eswatini
-
 Ethiopia
-
 Finland
-
 France
-
 Georgia
-
 Germany
-
 Ghana
Ghana
-
 Greece
-
 Haiti
Haiti
-
 Hong Kong
-
 Hungary
-
 India
India
-
 Indonesia
-
 Iran, Islamic republic
-
 Iraq
Iraq
-
 Ireland
-
 Israel
-
 Italy
Italy
-
 Jamaica
-
 Japan
Japan
-
 Jordan
-
 Kazakhstan
-
 Kenya
Kenya
-
 Korea
Korea
-
 Kuwait
-
 Kyrgyzstan
-
 Laos
Laos
-
 Latvia
-
 Lebanon
-
 Lesotho
-
 Libya
Libya
-
 Lithuania
-
 Luxembourg
-
 Madagascar
-
 Malaysia
-
 Malta
Malta
-
 Mauritius
-
 Mexico
-
 Moldova
-
 Mongolia
-
 Montenegro
-
 Morocco
-
 Mozambique
-
 Myanmar
-
 Namibia
-
 Nepal
Nepal
-
 Netherlands
-
 New Zealand
-
 Nigeria
-
 North Macedonia
-
 Norway
-
 Oman
Oman
-
 Pakistan
-
 Palestine
-
 Panama
-
 Papua New Guinea
-
 Paraguay
-
 Peru
Peru
-
 Philippines
-
 Poland
-
 Portugal
-
 Puerto Rico
-
 Qatar
Qatar
-
 Reunion
-
 Romania
-
 Rwanda
-
 Saudi Arabia
-
 Serbia
-
 Singapore
-
 Slovakia
-
 Slovenia
-
 Somalia
-
 South Africa
-
 Spain
Spain
-
 Sri Lanka
-
 Sweden
-
 Switzerland
-
 Syria
Syria
-
 Taiwan
-
 Tajikistan
-
 Tanzania
-
 Thailand
-
 Trinidad and Tobago
-
 Tunisia
-
 Turkey
-
 UAE
UAE
-
 Uganda
-
 Ukraine
-
 United Kingdom
-
United States
-
 Uruguay
-
 Uzbekistan
-
 Venezuela
-
 Vietnam
-
 Yemen
Yemen
-
 Zambia
-
 Zimbabwe
- Forex
- Crypto












