

Quant price outlook: Bearish momentum and oversold readings drive downside prospects

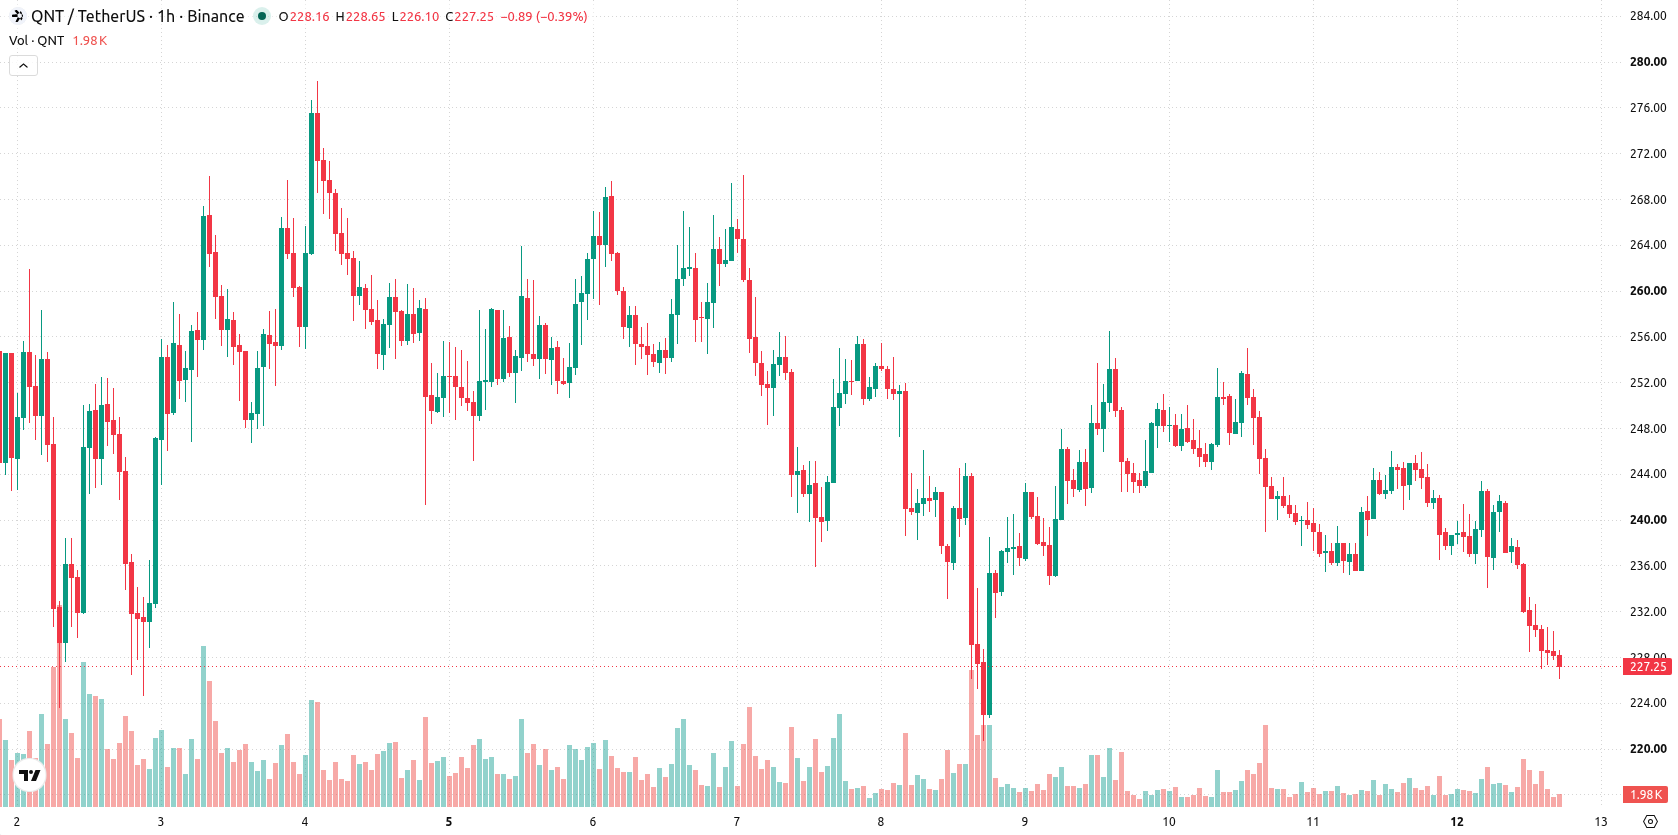
Quant (QNT) is trading at $227.04, down 6.98% on the day and currently sitting below its key short- and medium-term moving averages. Despite today's decline, price remains well above its key long-term average.
 243.36
270.140000
243.36
270.140000
Highlights
- Quant's circulating supply has reached 12.07 million tokens, or 81% of its 14.88 million maximum supply.
- Following a recent 435% price gain, Quant faces continued selling pressure as it tests support at $223 within a falling triangle.
- QNT/USD trades below key moving averages with multiple oversold signals, projected to consolidate between $215.97 and $238.11 over the next 2 to 3 days.
Supply concentration and technical pattern drive inflection amid selling pressure
Quant's circulating supply has reached 12.07 million tokens out of a maximum 14.88 million, amounting to roughly 81% of its total possible supply, according to Coingabbar. This token distribution may impact long-term liquidity, but has limited immediate effect on price movement. Recent technical formation within a falling triangle and a support test at $223 suggest a supply-demand inflection point, while volatility has followed a period when Quant recorded a 435% gain over the last week, as reported by Idoslaunchpad, though price action has remained under broader selling pressure.
Bearish momentum persists as resistance holds and indicators hit oversold
On the h1 timeframe, QNT/USD remains below both the MA-20 and MA-50, confirming notable short- and medium-term resistance. The daily MA-200 is positioned well below current price and serves as robust long-term support, while Ichimoku Kijun at $236.44 presents immediate overhead resistance. Technical indicators reveal ongoing bearish momentum, with MACD trending lower and ADX showing a neutral trend. RSI, Stoch RSI, CCI, and Bull/Bear Power all register oversold readings, highlighting sustained seller dominance and heavy intraday pressure. The Awesome Oscillator signals further potential selling, but widespread oversold signals may indicate some short-term exhaustion among sellers.
Downside risk elevated as consolidation expected within volatility band
In the coming 2 to 3 days, QNT/USD is projected to fluctuate within a volatility band between $215.97 and $238.11. Probabilities currently favor continued downside, with a 77% likelihood of a downward move and only a 23% chance of an upward move. The most likely scenario is for price action to consolidate sideways inside this band. A breakout above $236.44 could open a bullish scenario, whereas failure of support at $215.97 could accelerate further declines.
Previously it was reported that Quant’s outlook was supported by its growing institutional adoption and persistent bullish momentum, contingent on sustained demand against emerging resistance. The current technical landscape signals a shift toward consolidation and increased downside risk, making the $215.97 support level the primary threshold for traders to monitor in the near term.










-
 Afghanistan
-
 Albania
-
 Algeria
-
 Angola
-
 Argentina
-
 Armenia
-
 Australia
-
 Austria
-
 Azerbaijan
-
 Bahamas
-
 Bahrain
-
 Bangladesh
-
 Belarus
-
 Belgium
-
 Bolivia
-
 Botswana
-
 Brazil
-
 Brunei
-
 Bulgaria
-
 Cambodia
-
 Cameroon
-
 Canada
-
 Chile
Chile
-
 China
China
-
 Colombia
-
 Congo
Congo
-
 Costa Rica
-
 Cote d'Ivoire
-
 Croatia
-
 Cuba
Cuba
-
 Cyprus
-
 Czechia
-
 DR Congo
-
 Denmark
-
 Dominican Republic
-
 Ecuador
-
 Egypt
Egypt
-
 El Salvador
-
 Estonia
-
 Eswatini
-
 Ethiopia
-
 Finland
-
 France
-
 Georgia
-
 Germany
-
 Ghana
Ghana
-
 Greece
-
 Haiti
Haiti
-
 Hong Kong
-
 Hungary
-
 India
India
-
 Indonesia
-
 Iran, Islamic republic
-
 Iraq
Iraq
-
 Ireland
-
 Israel
-
 Italy
Italy
-
 Jamaica
-
 Japan
Japan
-
 Jordan
-
 Kazakhstan
-
 Kenya
Kenya
-
 Korea
Korea
-
 Kuwait
-
 Kyrgyzstan
-
 Laos
Laos
-
 Latvia
-
 Lebanon
-
 Lesotho
-
 Libya
Libya
-
 Lithuania
-
 Luxembourg
-
 Madagascar
-
 Malaysia
-
 Malta
Malta
-
 Mauritius
-
 Mexico
-
 Moldova
-
 Mongolia
-
 Montenegro
-
 Morocco
-
 Mozambique
-
 Myanmar
-
 Namibia
-
 Nepal
Nepal
-
 Netherlands
-
 New Zealand
-
 Nigeria
-
 North Macedonia
-
 Norway
-
 Oman
Oman
-
 Pakistan
-
 Palestine
-
 Panama
-
 Papua New Guinea
-
 Paraguay
-
 Peru
Peru
-
 Philippines
-
 Poland
-
 Portugal
-
 Puerto Rico
-
 Qatar
Qatar
-
 Reunion
-
 Romania
-
 Rwanda
-
 Saudi Arabia
-
 Serbia
-
 Singapore
-
 Slovakia
-
 Slovenia
-
 Somalia
-
 South Africa
-
 Spain
Spain
-
 Sri Lanka
-
 Sweden
-
 Switzerland
-
 Syria
Syria
-
 Taiwan
-
 Tajikistan
-
 Tanzania
-
 Thailand
-
 Trinidad and Tobago
-
 Tunisia
-
 Turkey
-
 UAE
UAE
-
 Uganda
-
 Ukraine
-
 United Kingdom
-
United States
-
 Uruguay
-
 Uzbekistan
-
 Venezuela
-
 Vietnam
-
 Yemen
Yemen
-
 Zambia
-
 Zimbabwe
- Forex
- Crypto












