

Quant technical analysis: Downward price move continues with sellers dominating intraday action

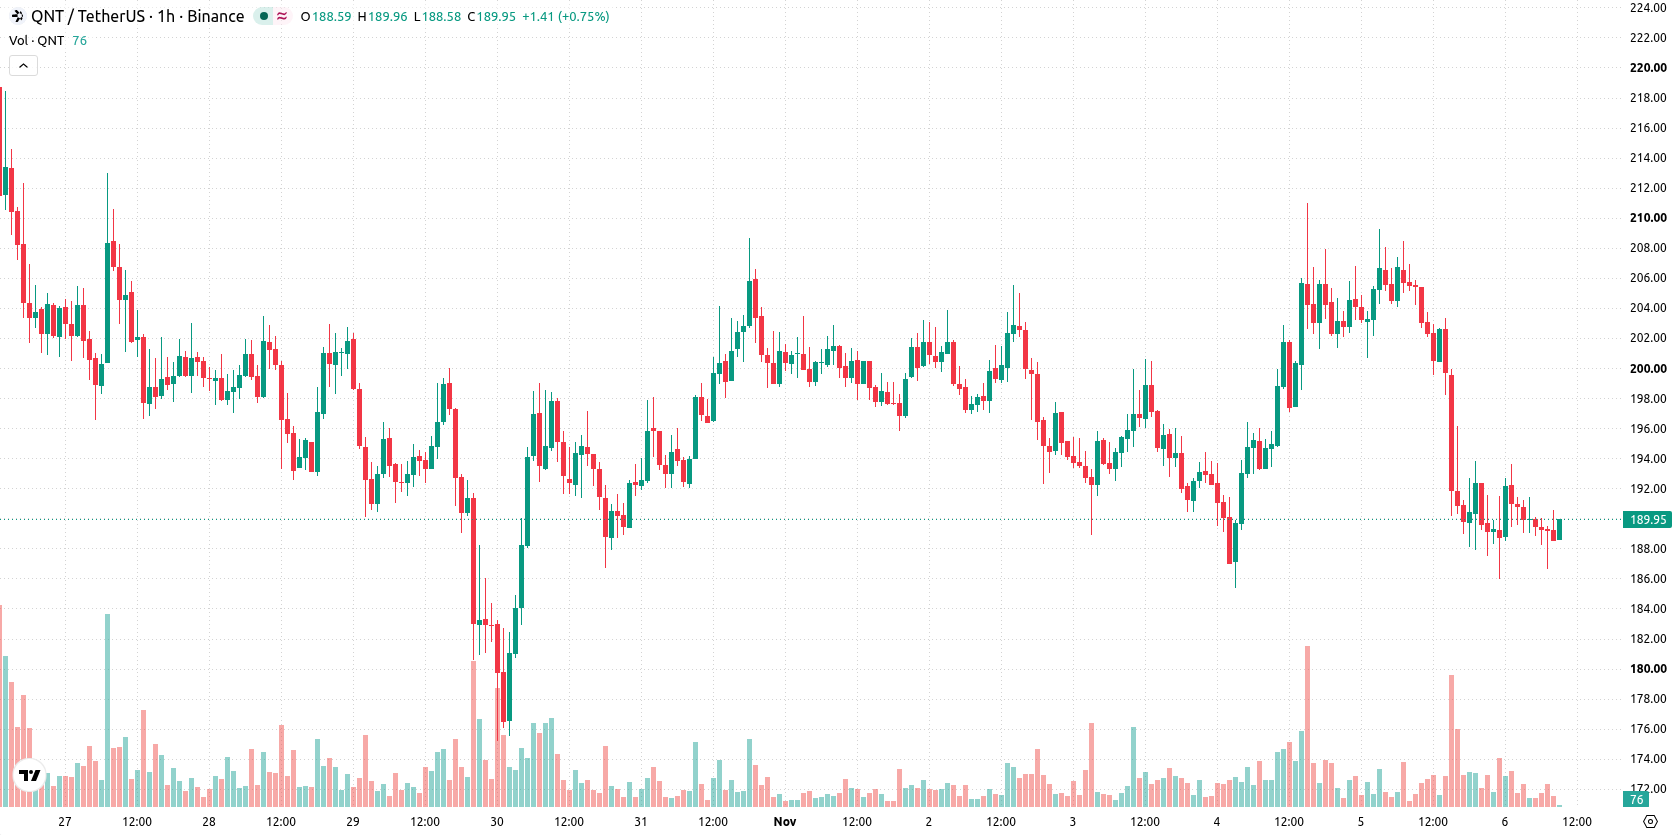
Quant (QNT) is trading at $189.41, reflecting a daily loss of 7.44%. The asset remains below its key short- and medium-term moving averages but continues to hold above the primary long-term level.
 201.5
210.980000
Highlights
- Quantinuum reported third-quarter 2026 revenue of $9.1 million, gaining 233% compared to the previous year.
- The company increased its 2026 revenue outlook to $31 million to $34 million and secured its largest cloud contract through 2029.
- Quant trades under heavy selling pressure, with technical indicators showing bearish momentum and a projected range of $183.68 to $206.54.
Revenue surge and new contracts fail to stem selling pressure
Quantinuum reported third-quarter 2026 revenue of $9.1 million, marking a 233% increase from the previous year, according to Thequantuminsider. This surge in reported earnings underscores substantial growth in enterprise engagement but has not translated into immediate price recovery. The company also raised its full-year revenue outlook to between $31 million and $34 million and locked in its largest cloud services contract to date with a global financial institution through 2029, as reported by Thequantuminsider. Additional product updates in September 2026 included the release of error-correction and fault-tolerant enhancements for the Nexus platform, according to Investing.com, though price action has remained under broader selling pressure.
Bearish bias persists as sellers test resistance and oscillators stay neutral
On the technical front, QNT is trading below both the MA-20 at $191.26 and MA-50 at $198.08 on the hourly chart, highlighting short- and medium-term resistance. The daily timeframe shows the price maintains some support above the MA-200 at $97.99, while immediate overhead resistance is defined by the Ichimoku Kijun at $197.18. MACD signals Strong Sell and ADX also points to a bearish bias, while the Bull/Bear Power at -0.99 confirms seller dominance for intraday moves. However, RSI, Stoch RSI, and CCI are neutral, and the Awesome Oscillator shows no clear directional bias, suggesting oscillators are not yet at oversold levels.
Downside risk elevated as price stalls within volatility range
Looking ahead, QNT is expected to consolidate within a volatility band between $183.68 and $206.54 in the short term. The probability of a move to the upside remains very low, with momentum favoring a further decline should support at $183.68 break. The baseline scenario envisions sideways action within this range, with any sustained rebound requiring a decisive break above immediate resistance at $197.18.
Earlier, analysts noted that Quant was exhibiting short-term bearish momentum despite maintaining a constructive long-term technical structure. The current article strengthens this narrative with persistent downside pressure following recent corporate developments, making the $183.68 support a key level to monitor for further downside risk.






Latest Quant News




-
 Afghanistan
-
 Albania
-
 Algeria
-
 Angola
-
 Argentina
-
 Armenia
-
 Australia
-
 Austria
-
 Azerbaijan
-
 Bahamas
-
 Bahrain
-
 Bangladesh
-
 Belarus
-
 Belgium
-
 Bolivia
-
 Botswana
-
 Brazil
-
 Brunei
-
 Bulgaria
-
 Cambodia
-
 Cameroon
-
 Canada
-
 Chile
-
 China
-
 Colombia
-
 Congo
-
 Costa Rica
-
 Cote d'Ivoire
-
 Croatia
-
 Cuba
-
 Cyprus
-
 Czechia
-
 DR Congo
-
 Denmark
-
 Dominican Republic
-
 Ecuador
-
 Egypt
-
 El Salvador
-
 Estonia
-
 Eswatini
-
 Ethiopia
-
 Finland
-
 France
-
 Georgia
-
 Germany
-
 Ghana
-
 Greece
-
 Haiti
-
 Hong Kong
-
 Hungary
-
 India
-
 Indonesia
-
 Iran, Islamic republic
-
 Iraq
-
 Ireland
-
 Israel
-
 Italy
-
 Jamaica
-
 Japan
-
 Jordan
-
 Kazakhstan
-
 Kenya
-
 Korea
-
 Kuwait
-
 Kyrgyzstan
-
 Laos
-
 Latvia
-
 Lebanon
-
 Lesotho
-
 Libya
-
 Lithuania
-
 Luxembourg
-
 Madagascar
-
 Malaysia
-
 Malta
-
 Mauritius
-
 Mexico
-
 Moldova
-
 Mongolia
-
 Montenegro
-
 Morocco
-
 Mozambique
-
 Myanmar
-
 Namibia
-
 Nepal
-
 Netherlands
-
 New Zealand
-
 Nigeria
-
 North Macedonia
-
 Norway
-
 Oman
-
 Pakistan
-
 Palestine
-
 Panama
-
 Papua New Guinea
-
 Paraguay
-
 Peru
-
 Philippines
-
 Poland
-
 Portugal
-
 Puerto Rico
-
 Qatar
-
 Reunion
-
 Romania
-
 Rwanda
-
 Saudi Arabia
-
 Serbia
-
 Singapore
-
 Slovakia
-
 Slovenia
-
 Somalia
-
 South Africa
-
 Spain
-
 Sri Lanka
-
 Sweden
-
 Switzerland
-
 Syria
-
 Taiwan
-
 Tajikistan
-
 Tanzania
-
 Thailand
-
 Trinidad and Tobago
-
 Tunisia
-
 Turkey
-
 UAE
-
 Uganda
-
 Ukraine
-
 United Kingdom
-
United States
-
 Uruguay
-
 Uzbekistan
-
 Venezuela
-
 Vietnam
-
 Yemen
-
 Zambia
-
 Zimbabwe
- Forex
- Crypto












