

Sui weekly outlook: Can SUI attract buyers amid record throughput and fresh institutional backing?

Institutional activity has been a powerful force for Sui (SUI) this week, as the asset trades near $1.01 after declining around 9%. The ecosystem is seeing fresh capital and cross-chain expansion, which could shape sentiment in the days ahead — market attention now turns to whether these developments will spark a recovery from oversold territory.
 0.7267
0.8698
Highlights
- Sui trades at $1.0086, falling 8.53% over the past week and finishing near the bottom of its weekly range.
- Momentum indicators suggest underlying bullish structure remains with potential for a near-term recovery after recent weakness.
- Key support is at $0.9595 and resistance at $1.0953, with an expected near-term range of $0.9119 to $1.2015.
Data Network buyout and network records drive sentiment amid ecosystem expansion
Sui Foundation committed $30 million to acquire the DATA Network, previously known as Story Protocol, which will now migrate its operations onto the Sui network according to CryptoBriefing. Recent institutional activity continues to shape the landscape, with the Hashi Bitcoin finance project set to launch its mainnet this month backed by more than $500 million in commitments and over 20 institutional partners, as reported by Coincentral. Sui also achieved a record throughput exceeding 40 million transactions per second during a Basecamp developer conference event according to CryptoBriefing. Additional key updates included Samsung Wallet integration for USDC and ongoing cross-chain and institutional initiatives within the Sui ecosystem.
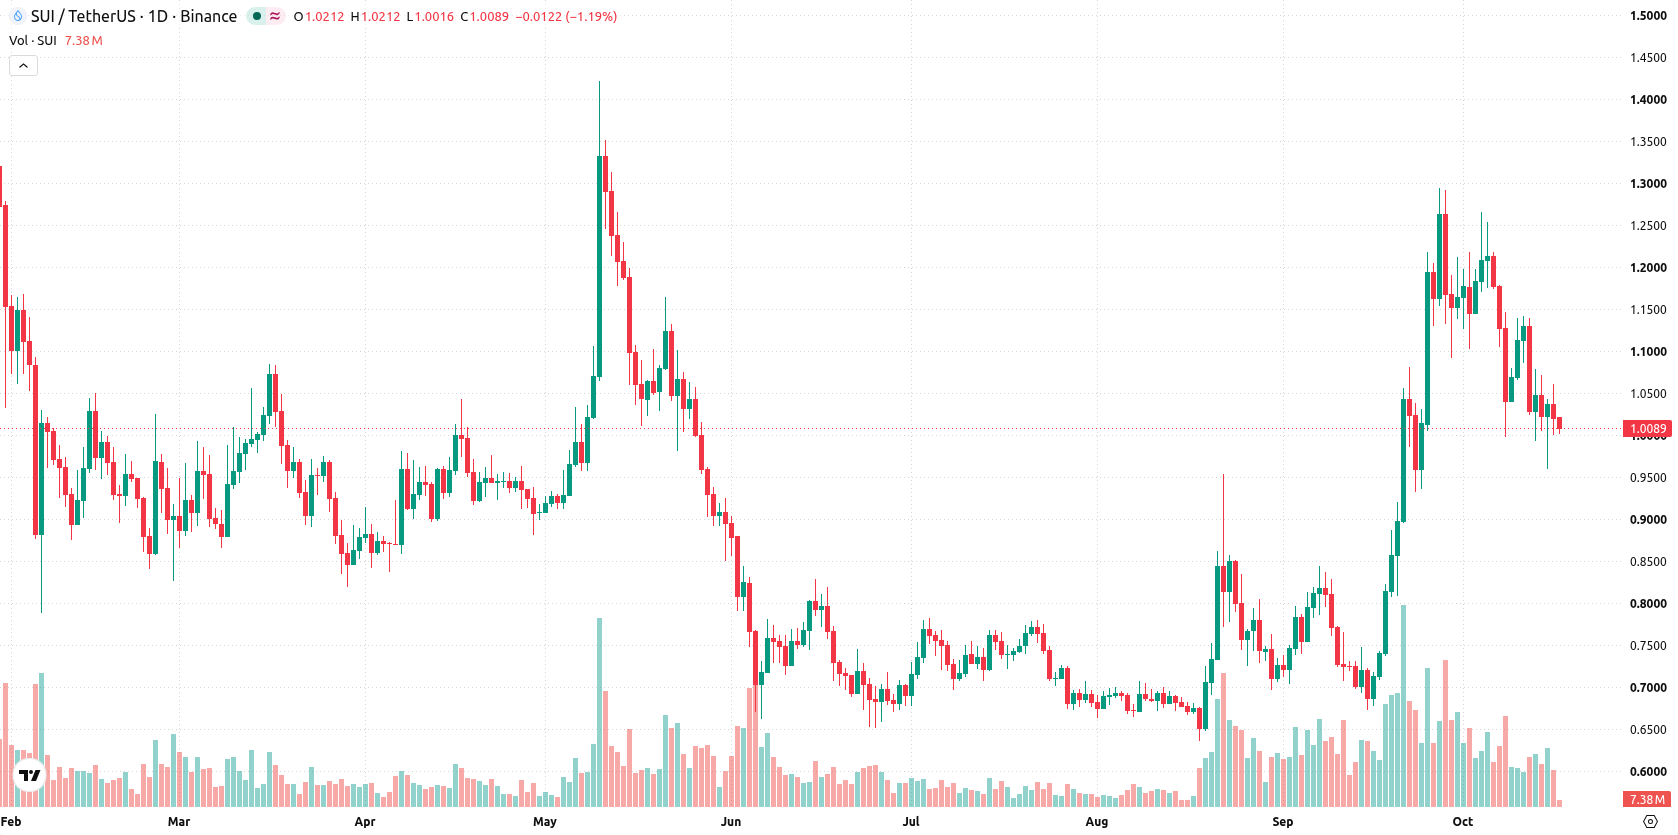
Oversold momentum flagged as volatility rises and indicators split direction
The daily chart shows a sustained move lower with a firm trend, as volatility climbed to 19.04%. The RSI is neutral at 47.1553, but Stoch RSI has entered the oversold zone, highlighting a potential for near-term recovery. Meanwhile, MACD remains in a buy direction, signaling persistent underlying bullish momentum. The nearest support is at $0.9595, with resistance at the Ichimoku Kijun level of $1.0953, framing the active trading range.
Breakout risk looms with balanced odds as key levels define the week
In the week ahead, the expected range spans from $0.9119 to $1.2015, with a 55% probability of an increase and 45% chance of a decrease. The base case calls for continued trading between support at $0.9595 and resistance at $1.0953. If Sui breaks above $1.0953, a push toward $1.2015 becomes likely. A drop below $0.9595 would open the way for losses toward the lower end of the forecast range at $0.9119.
Previously it was reported that Sui had begun to exhibit renewed upward momentum, though it continued to encounter notable technical resistance limiting further gains. In light of ongoing institutional involvement and new ecosystem developments, traders should monitor whether a sustained move above the $1.0953 resistance level can signal confirmation of a recovery or if prevailing downside risks will dominate in the coming sessions.










-
 Afghanistan
-
 Albania
-
 Algeria
-
 Angola
-
 Argentina
-
 Armenia
-
 Australia
-
 Austria
-
 Azerbaijan
-
 Bahamas
-
 Bahrain
-
 Bangladesh
-
 Belarus
-
 Belgium
-
 Bolivia
-
 Botswana
-
 Brazil
-
 Brunei
-
 Bulgaria
-
 Cambodia
-
 Cameroon
-
 Canada
-
 Chile
-
 China
-
 Colombia
-
 Congo
-
 Costa Rica
-
 Cote d'Ivoire
-
 Croatia
-
 Cuba
-
 Cyprus
-
 Czechia
-
 DR Congo
-
 Denmark
-
 Dominican Republic
-
 Ecuador
-
 Egypt
-
 El Salvador
-
 Estonia
-
 Eswatini
-
 Ethiopia
-
 Finland
-
 France
-
 Georgia
-
 Germany
-
 Ghana
-
 Greece
-
 Haiti
-
 Hong Kong
-
 Hungary
-
 India
-
 Indonesia
-
 Iran, Islamic republic
-
 Iraq
-
 Ireland
-
 Israel
-
 Italy
-
 Jamaica
-
 Japan
-
 Jordan
-
 Kazakhstan
-
 Kenya
-
 Korea
-
 Kuwait
-
 Kyrgyzstan
-
 Laos
-
 Latvia
-
 Lebanon
-
 Lesotho
-
 Libya
-
 Lithuania
-
 Luxembourg
-
 Madagascar
-
 Malaysia
-
 Malta
-
 Mauritius
-
 Mexico
-
 Moldova
-
 Mongolia
-
 Montenegro
-
 Morocco
-
 Mozambique
-
 Myanmar
-
 Namibia
-
 Nepal
-
 Netherlands
-
 New Zealand
-
 Nigeria
-
 North Macedonia
-
 Norway
-
 Oman
-
 Pakistan
-
 Palestine
-
 Panama
-
 Papua New Guinea
-
 Paraguay
-
 Peru
-
 Philippines
-
 Poland
-
 Portugal
-
 Puerto Rico
-
 Qatar
-
 Reunion
-
 Romania
-
 Rwanda
-
 Saudi Arabia
-
 Serbia
-
 Singapore
-
 Slovakia
-
 Slovenia
-
 Somalia
-
 South Africa
-
 Spain
-
 Sri Lanka
-
 Sweden
-
 Switzerland
-
 Syria
-
 Taiwan
-
 Tajikistan
-
 Tanzania
-
 Thailand
-
 Trinidad and Tobago
-
 Tunisia
-
 Turkey
-
 UAE
-
 Uganda
-
 Ukraine
-
 United Kingdom
-
United States
-
 Uruguay
-
 Uzbekistan
-
 Venezuela
-
 Vietnam
-
 Yemen
-
 Zambia
-
 Zimbabwe
- Forex
- Crypto












