


Strong technical momentum drove Sandbox (SAND) up 9.34% as buyers returned in force, with price staging an advance after an early downside gap. The rally is supported by a break above short- and medium-term moving averages, although lingering bearish alignment in the longer-term trend limits immediate upside.
 0.0366
0.0441
Highlights
- SAND/USD trades above short-, medium-, and long-term moving averages, confirming momentum across timeframes but with an overall long-term bearish trend alignment.
- Technical signals are mixed as MACD shows buy momentum, but RSI gives a sell signal and Stochastic RSI flags oversold conditions.
- Trading near the daily high after a 9.34% advance, SAND/USD is expected to move between $0.0445 to $0.0679 over the next five sessions, with balanced upside and downside probabilities.
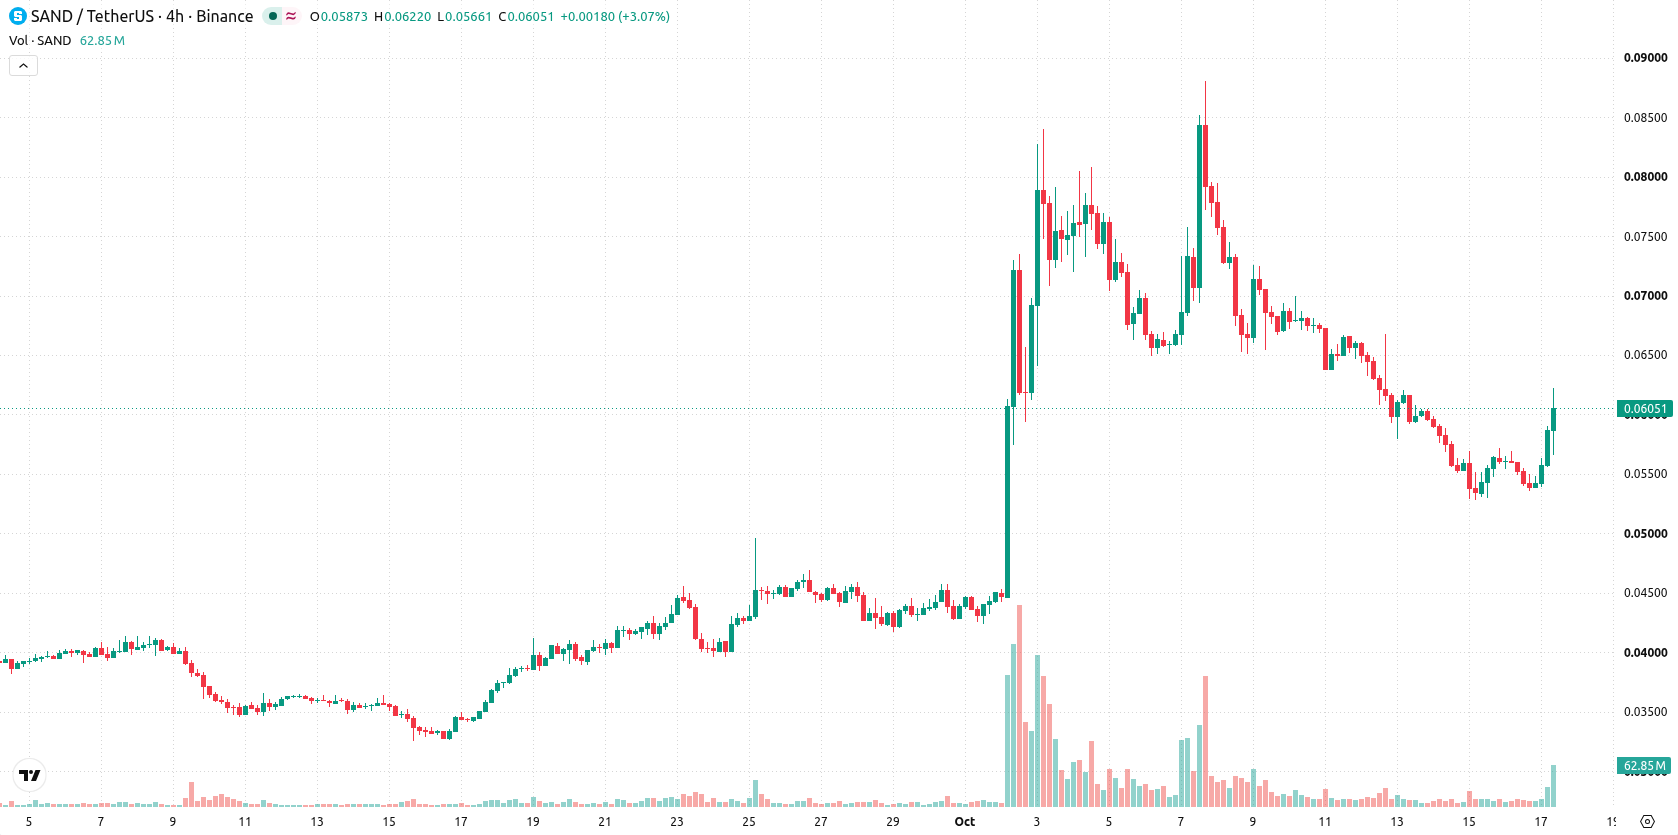
Mixed momentum signals amid resistance test and volatility spike
SAND/USD is trading above the 20-day ($0.0605), 50-day ($0.0476), and 200-day ($0.0563) moving averages, confirming upward momentum in short-, medium-, and long-term trends. The nearest overhead resistance is at $0.0638 (Ichimoku Kijun), with support from the 20-day average at $0.0605. Longer-term trend alignment remains bearish. Momentum signals are mixed: MACD points to strong buy momentum, ADX indicates trend firmness, while RSI at 47.45 flashes a 'Sell' and Stochastic RSI at 0 highlights oversold conditions. The CCI is neutral, and Bull/Bear Power (BBP) at -0.003 signals sellers' slight intraday advantage. SAND/USD trades near the daily high with intraday volatility at 9.46%, showcasing upward drive alongside selling and oversold signals from oscillators.
Earlier, analysts noted that Sandbox's technical outlook was characterized by prevailing bullish momentum tempered by rising volatility and caution over potential reversals. The current rebound, while supported by short- and medium-term strength, reinforces the need to closely monitor the $0.0638 resistance as a potential inflection point for a directional move in the coming sessions.









-
 Afghanistan
-
 Albania
-
 Algeria
-
 Angola
-
 Argentina
-
 Armenia
-
 Australia
-
 Austria
-
 Azerbaijan
-
 Bahamas
-
 Bahrain
-
 Bangladesh
-
 Belarus
-
 Belgium
-
 Bolivia
-
 Botswana
-
 Brazil
-
 Brunei
-
 Bulgaria
-
 Cambodia
-
 Cameroon
-
 Canada
-
 Chile
-
 China
-
 Colombia
-
 Congo
-
 Costa Rica
-
 Cote d'Ivoire
-
 Croatia
-
 Cuba
-
 Cyprus
-
 Czechia
-
 DR Congo
-
 Denmark
-
 Dominican Republic
-
 Ecuador
-
 Egypt
-
 El Salvador
-
 Estonia
-
 Eswatini
-
 Ethiopia
-
 Finland
-
 France
-
 Georgia
-
 Germany
-
 Ghana
-
 Greece
-
 Haiti
-
 Hong Kong
-
 Hungary
-
 India
-
 Indonesia
-
 Iran, Islamic republic
-
 Iraq
-
 Ireland
-
 Israel
-
 Italy
-
 Jamaica
-
 Japan
-
 Jordan
-
 Kazakhstan
-
 Kenya
-
 Korea
-
 Kuwait
-
 Kyrgyzstan
-
 Laos
-
 Latvia
-
 Lebanon
-
 Lesotho
-
 Libya
-
 Lithuania
-
 Luxembourg
-
 Madagascar
-
 Malaysia
-
 Malta
-
 Mauritius
-
 Mexico
-
 Moldova
-
 Mongolia
-
 Montenegro
-
 Morocco
-
 Mozambique
-
 Myanmar
-
 Namibia
-
 Nepal
-
 Netherlands
-
 New Zealand
-
 Nigeria
-
 North Macedonia
-
 Norway
-
 Oman
-
 Pakistan
-
 Palestine
-
 Panama
-
 Papua New Guinea
-
 Paraguay
-
 Peru
-
 Philippines
-
 Poland
-
 Portugal
-
 Puerto Rico
-
 Qatar
-
 Reunion
-
 Romania
-
 Rwanda
-
 Saudi Arabia
-
 Serbia
-
 Singapore
-
 Slovakia
-
 Slovenia
-
 Somalia
-
 South Africa
-
 Spain
-
 Sri Lanka
-
 Sweden
-
 Switzerland
-
 Syria
-
 Taiwan
-
 Tajikistan
-
 Tanzania
-
 Thailand
-
 Trinidad and Tobago
-
 Tunisia
-
 Turkey
-
 UAE
-
 Uganda
-
 Ukraine
-
 United Kingdom
-
United States
-
 Uruguay
-
 Uzbekistan
-
 Venezuela
-
 Vietnam
-
 Yemen
-
 Zambia
-
 Zimbabwe
- Forex
- Crypto












